NETWORKS AND TRANSPORT
TYC GIS provides advisory and consulting services for the development of studies related to transport, fleets and accessibility. GIS in combination with models and extensions allow us to analyze from different points of view factors such as accessibility, optimal delivery and collection routes, fleet management, etc., that optimize the assets dedicated by companies and organizations in this area.
In the last years, marketing, waste collection, advertising and mailing companies have seen in these technologies key tools to improve management, coordination and expenses optimization for their fleets and sales teams.
-
Transport network analysis: Optimal routes, optimal routes for several vehicles and accessibility to centers calculations.
-
Dynamic segmentation and linear referencing.
-
Projects
Our services include from the development of projects and “ad hoc” calculations to comprehensive counseling to the customers so they can develop these analysis. This comprehensive counseling includes the training of your team, consulting and sizing for the purchase of licenses and support for the first projects.
«We put within your reach everything you need to implement these tools on your activities, ensuring your investment»
TRANSPORT NETWORK ANALYSIS
GIS network analysis tools (QGIS, ArcGIS – Network Analysis, among others) allows us to design a Strategic Transport Model adapted to the specific needs for each project.
With these models, flows in several transport means are analyzed through a network that integrates their travel and operation characteristics, allowing the calculation of optimal routes, territorial accessibility, pick up and delivery routes by various vehicles, etc.
Fleet control, geomarketing, passenger catchment per spot, optimal routes for delivery, areas of influence of fire stations, optimization of pick-up routes of solid waste (both pedestrian and truck), relocation of public transport stops, are some of the projects that have been analyzed with this tool.
Optimal routes
The possibility of customizing the type of network according to speed, directions, turning restrictions, slopes, etc., combined with the configuration of the type of vehicle or mobile element according to its autonomy, downtime, capacity, lateral load, etc., allows detailed and realistic analysis of the most adequate route to follow in order to optimize time and fuel costs.
Optimal routes for several vehicles and to cover several events
In addition to the detailed in the previous section, this type of tools allow us to enter multiple exit points and pick-up and delivery points, as well as multiple vehicles and individuals with their own characteristics.
All of this allows us to develop complex analyses that help us to design optimal delivery and collection routes, size your fleet and optimization of collection times.
Accessibility studies
Just as the dimensioning of transport networks and vehicle and individual characteristics allows us to analyze the optimal routes, it also allows us to calculate the service areas or accessibility in isochrones of points of sale/shops/supply centers.
These calculations allow us to analyze the areas of the territory covered in a given time and given type of transport, which helps in the dimensioning of commercial networks, opportunity areas or overlapping areas.
The combination of different types of transport (road, train, subway, etc.) allows for advanced mobility analyses that help in urban planning, infrastructure design, etc.
DYNAMIC SEGMENTATION
Dynamic segmentation helps “analysis and understanding of linear data” and consists on locating in real time along a previously calibrated network, roads, rivers, railways, etc., events that help in the management of the network. In this way, elements are not only referenced by X-Y coordinates, but to kilometer points of the network (linear reference).
The preparation of transport and accessibility studies sometimes requires the inclusion of real time events that affect the analysis itself (accidents, road closures, traffic jams, etc.). Dynamic segmentation allows to introduce in real time such events either in classic X-Y coordinates format or in linear reference such as kilometer points (KP).
SOME PROJECTS COMPLETED
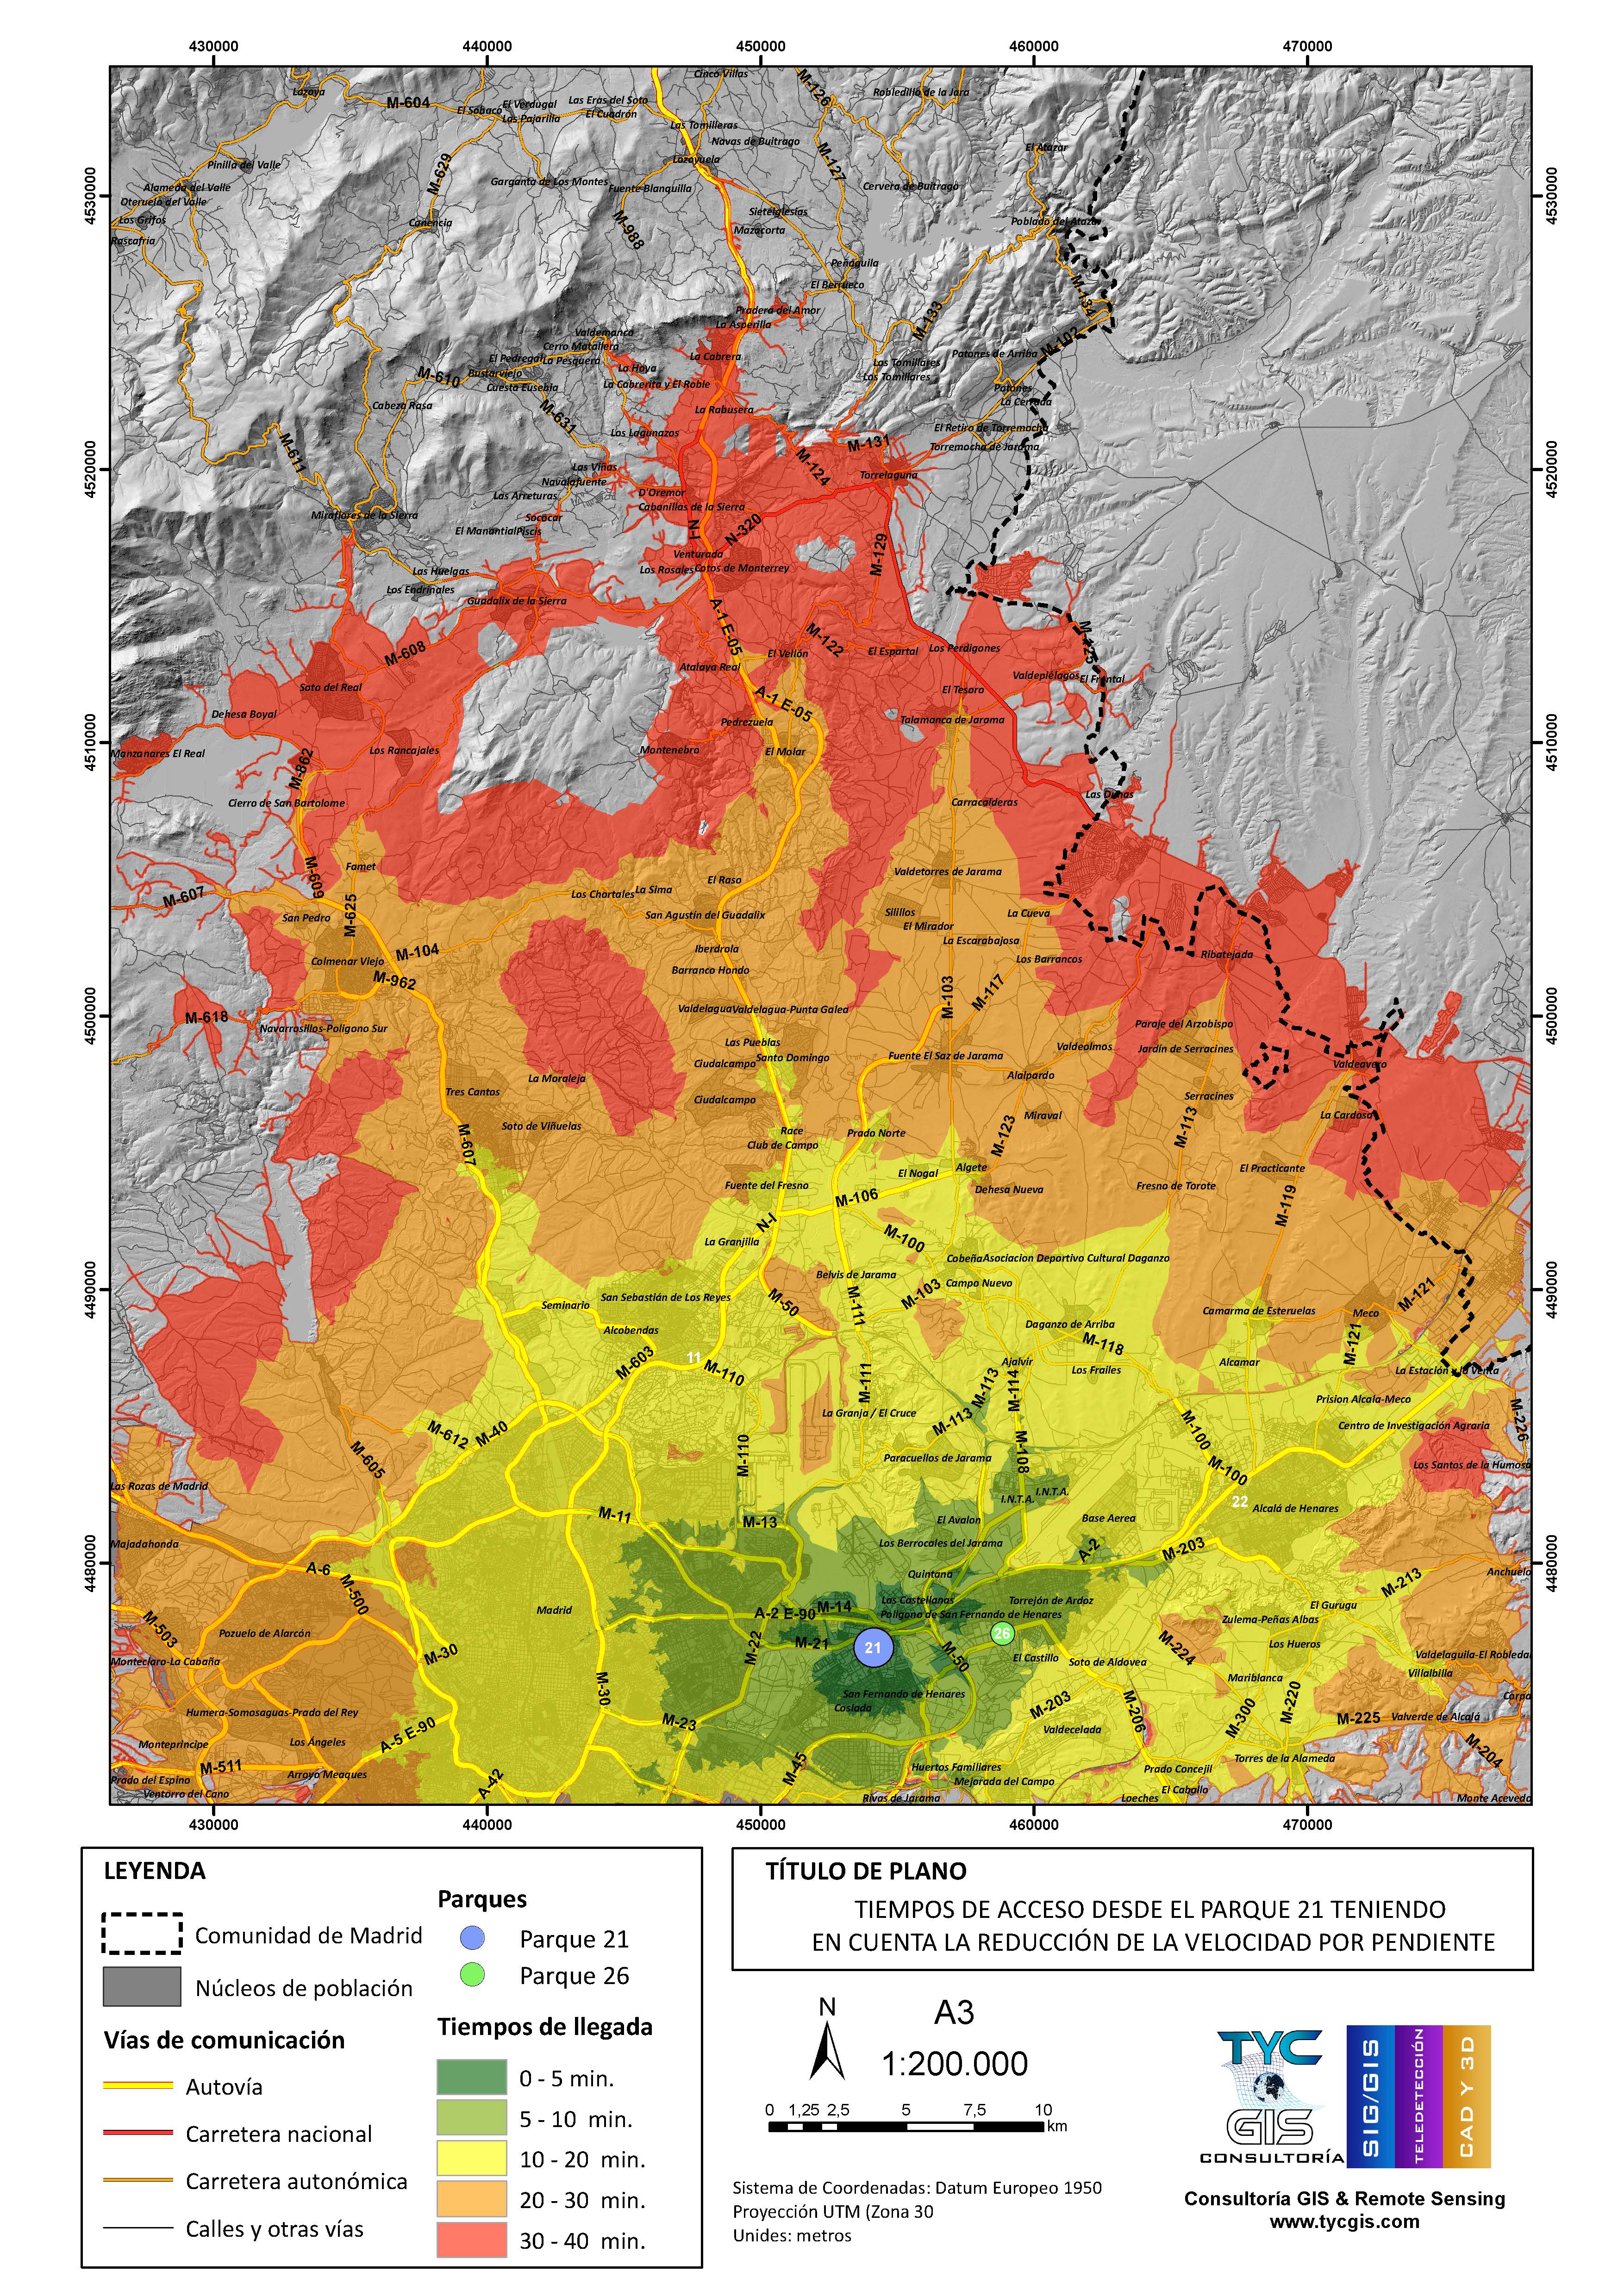
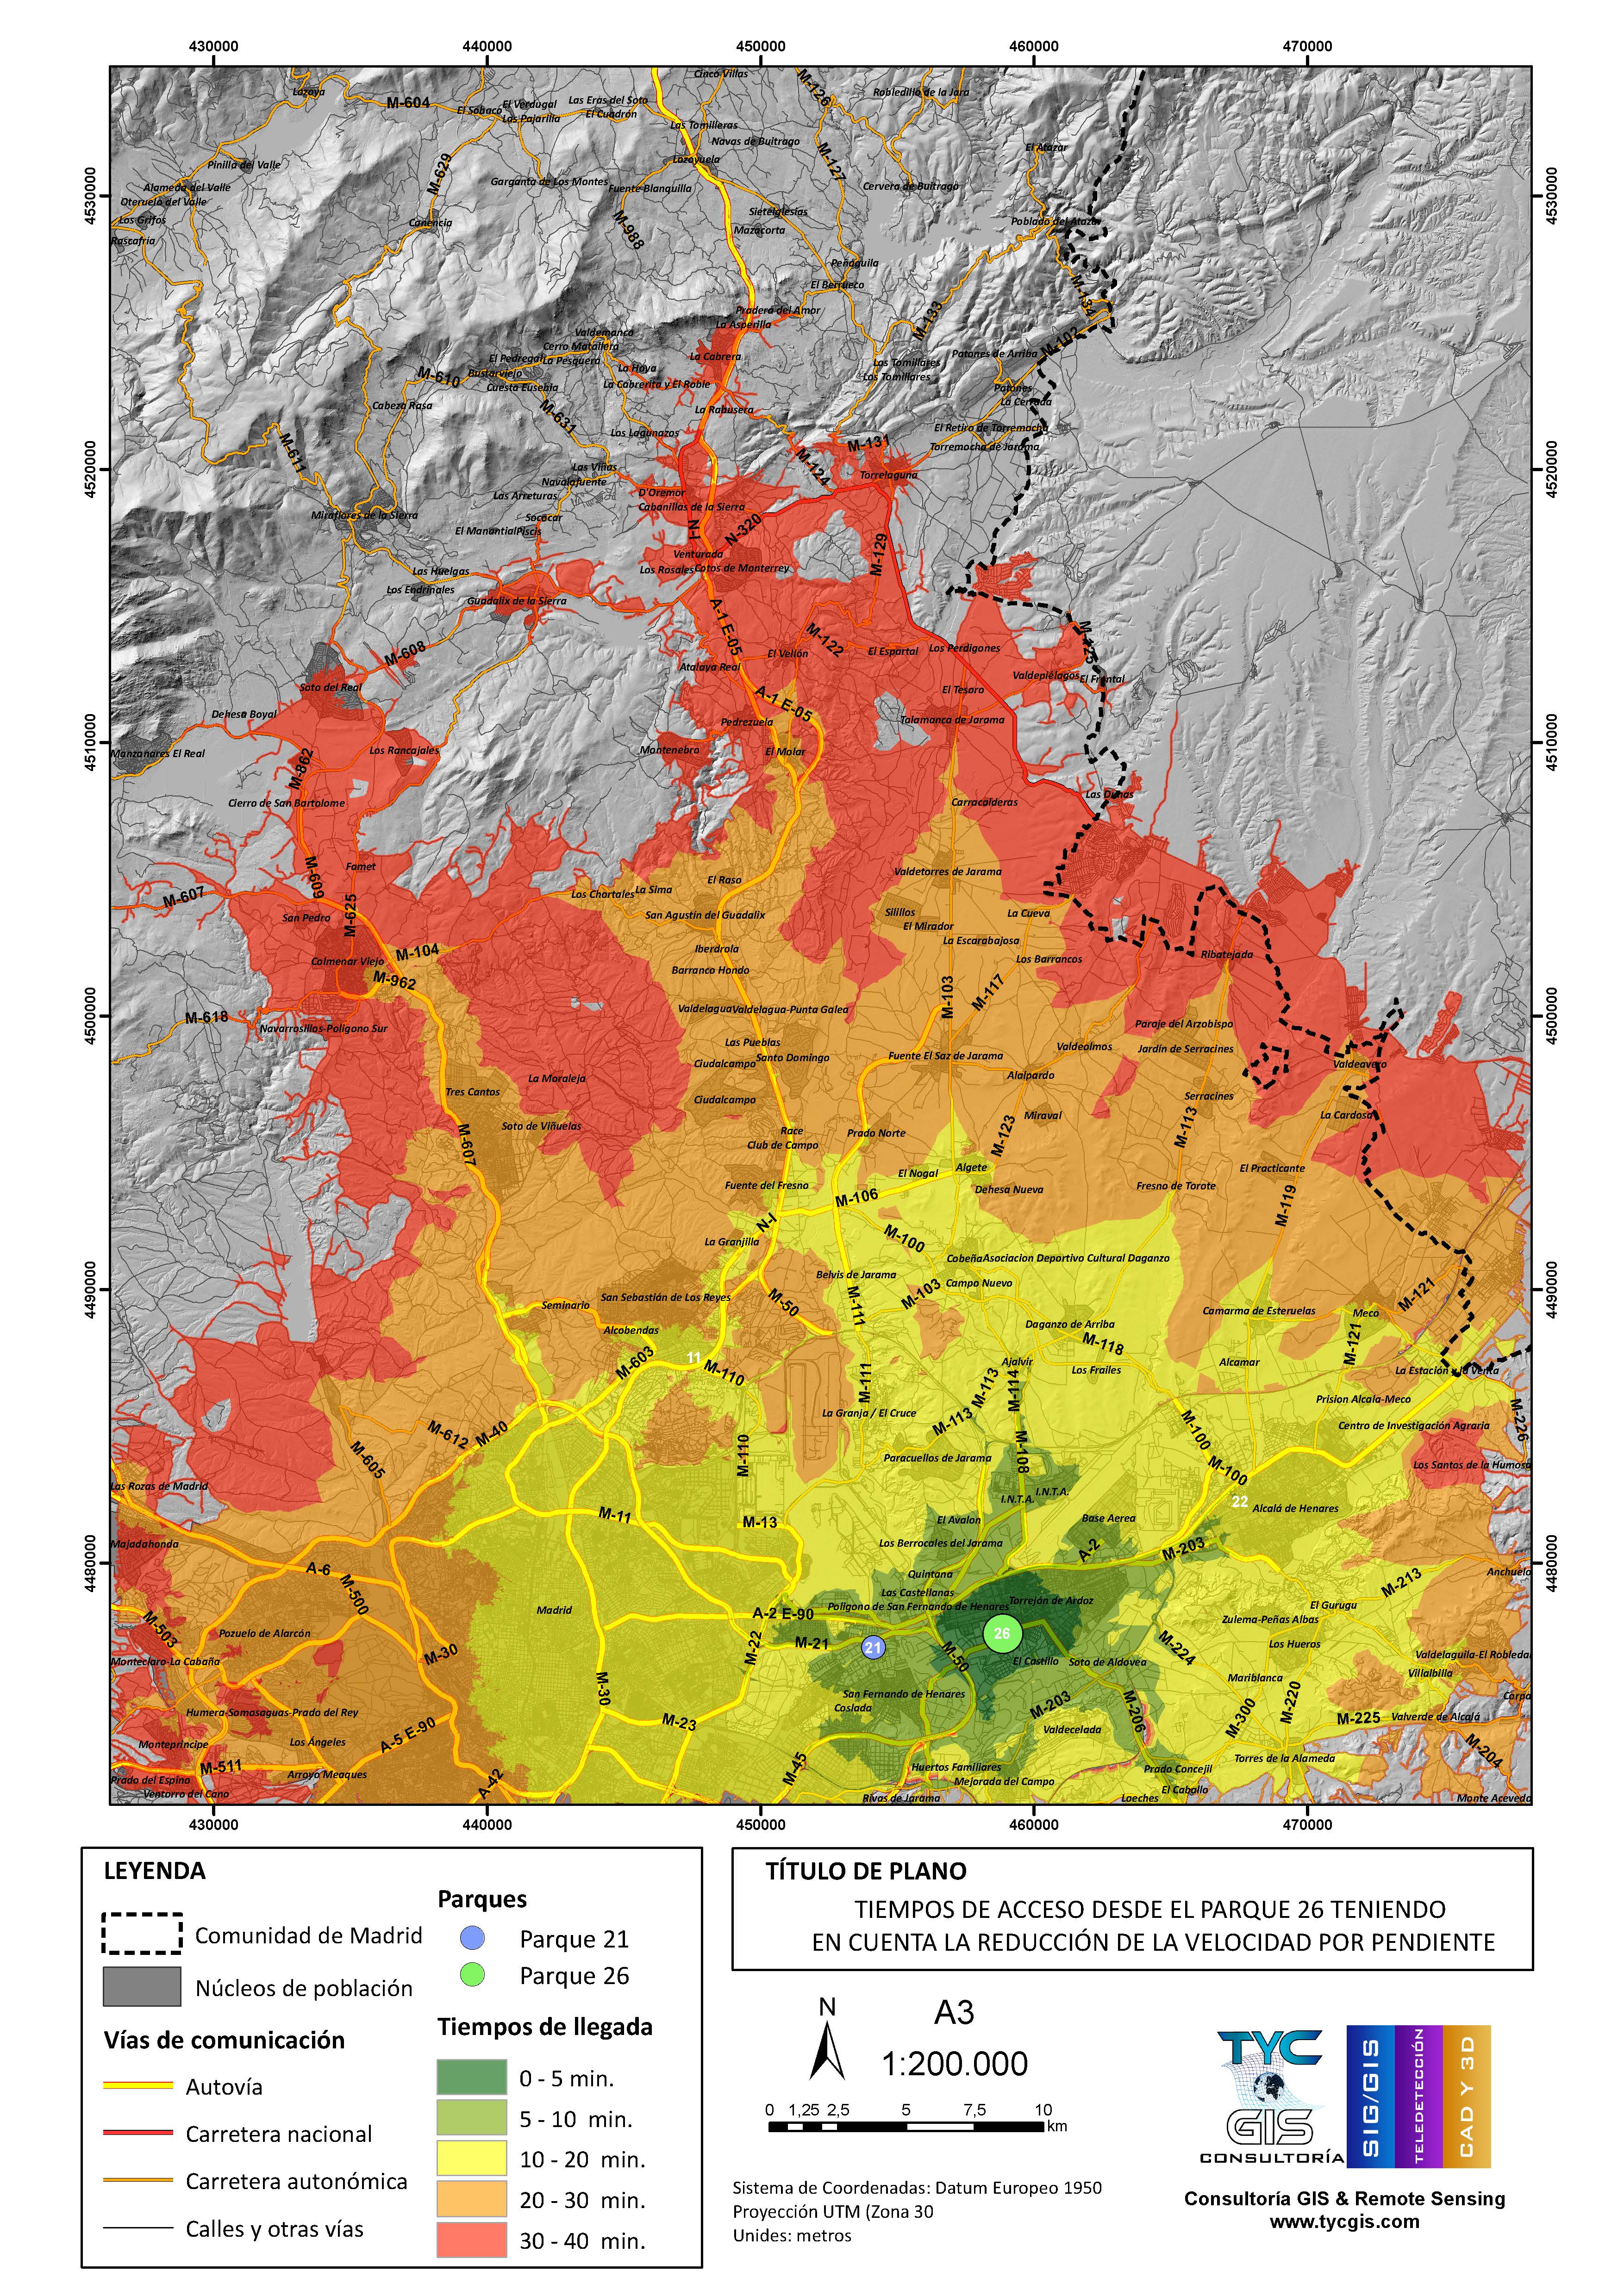
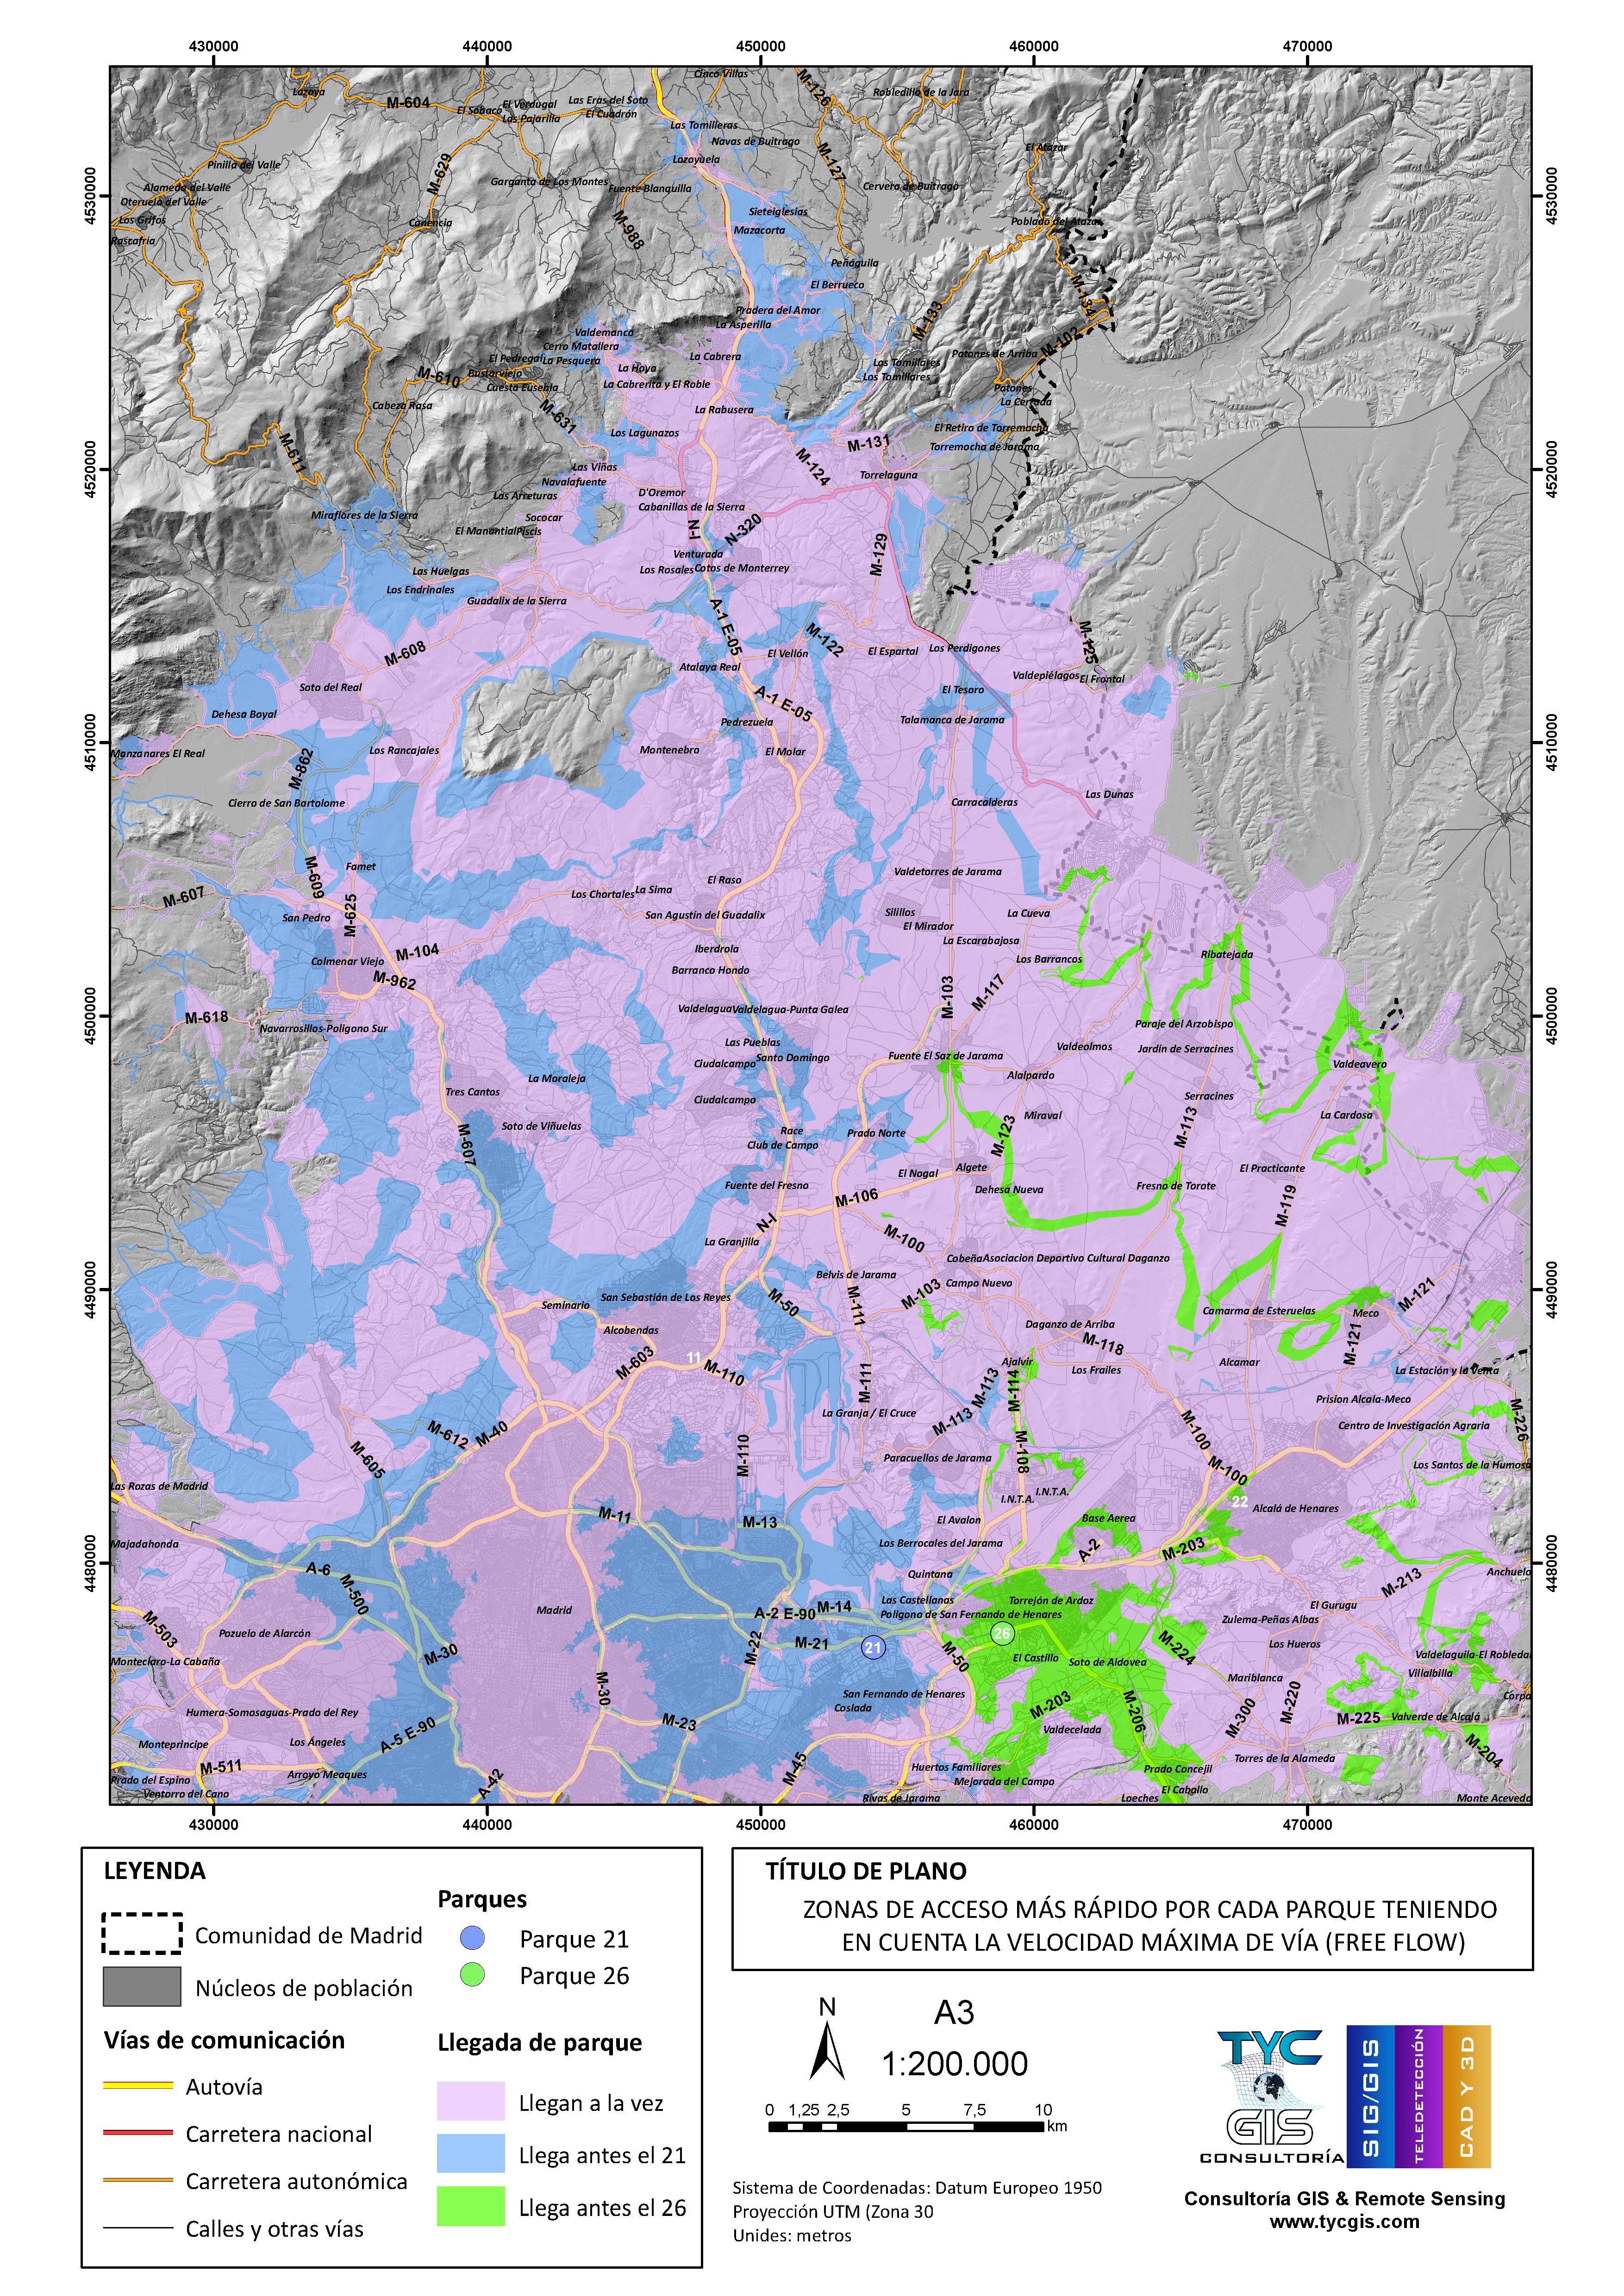
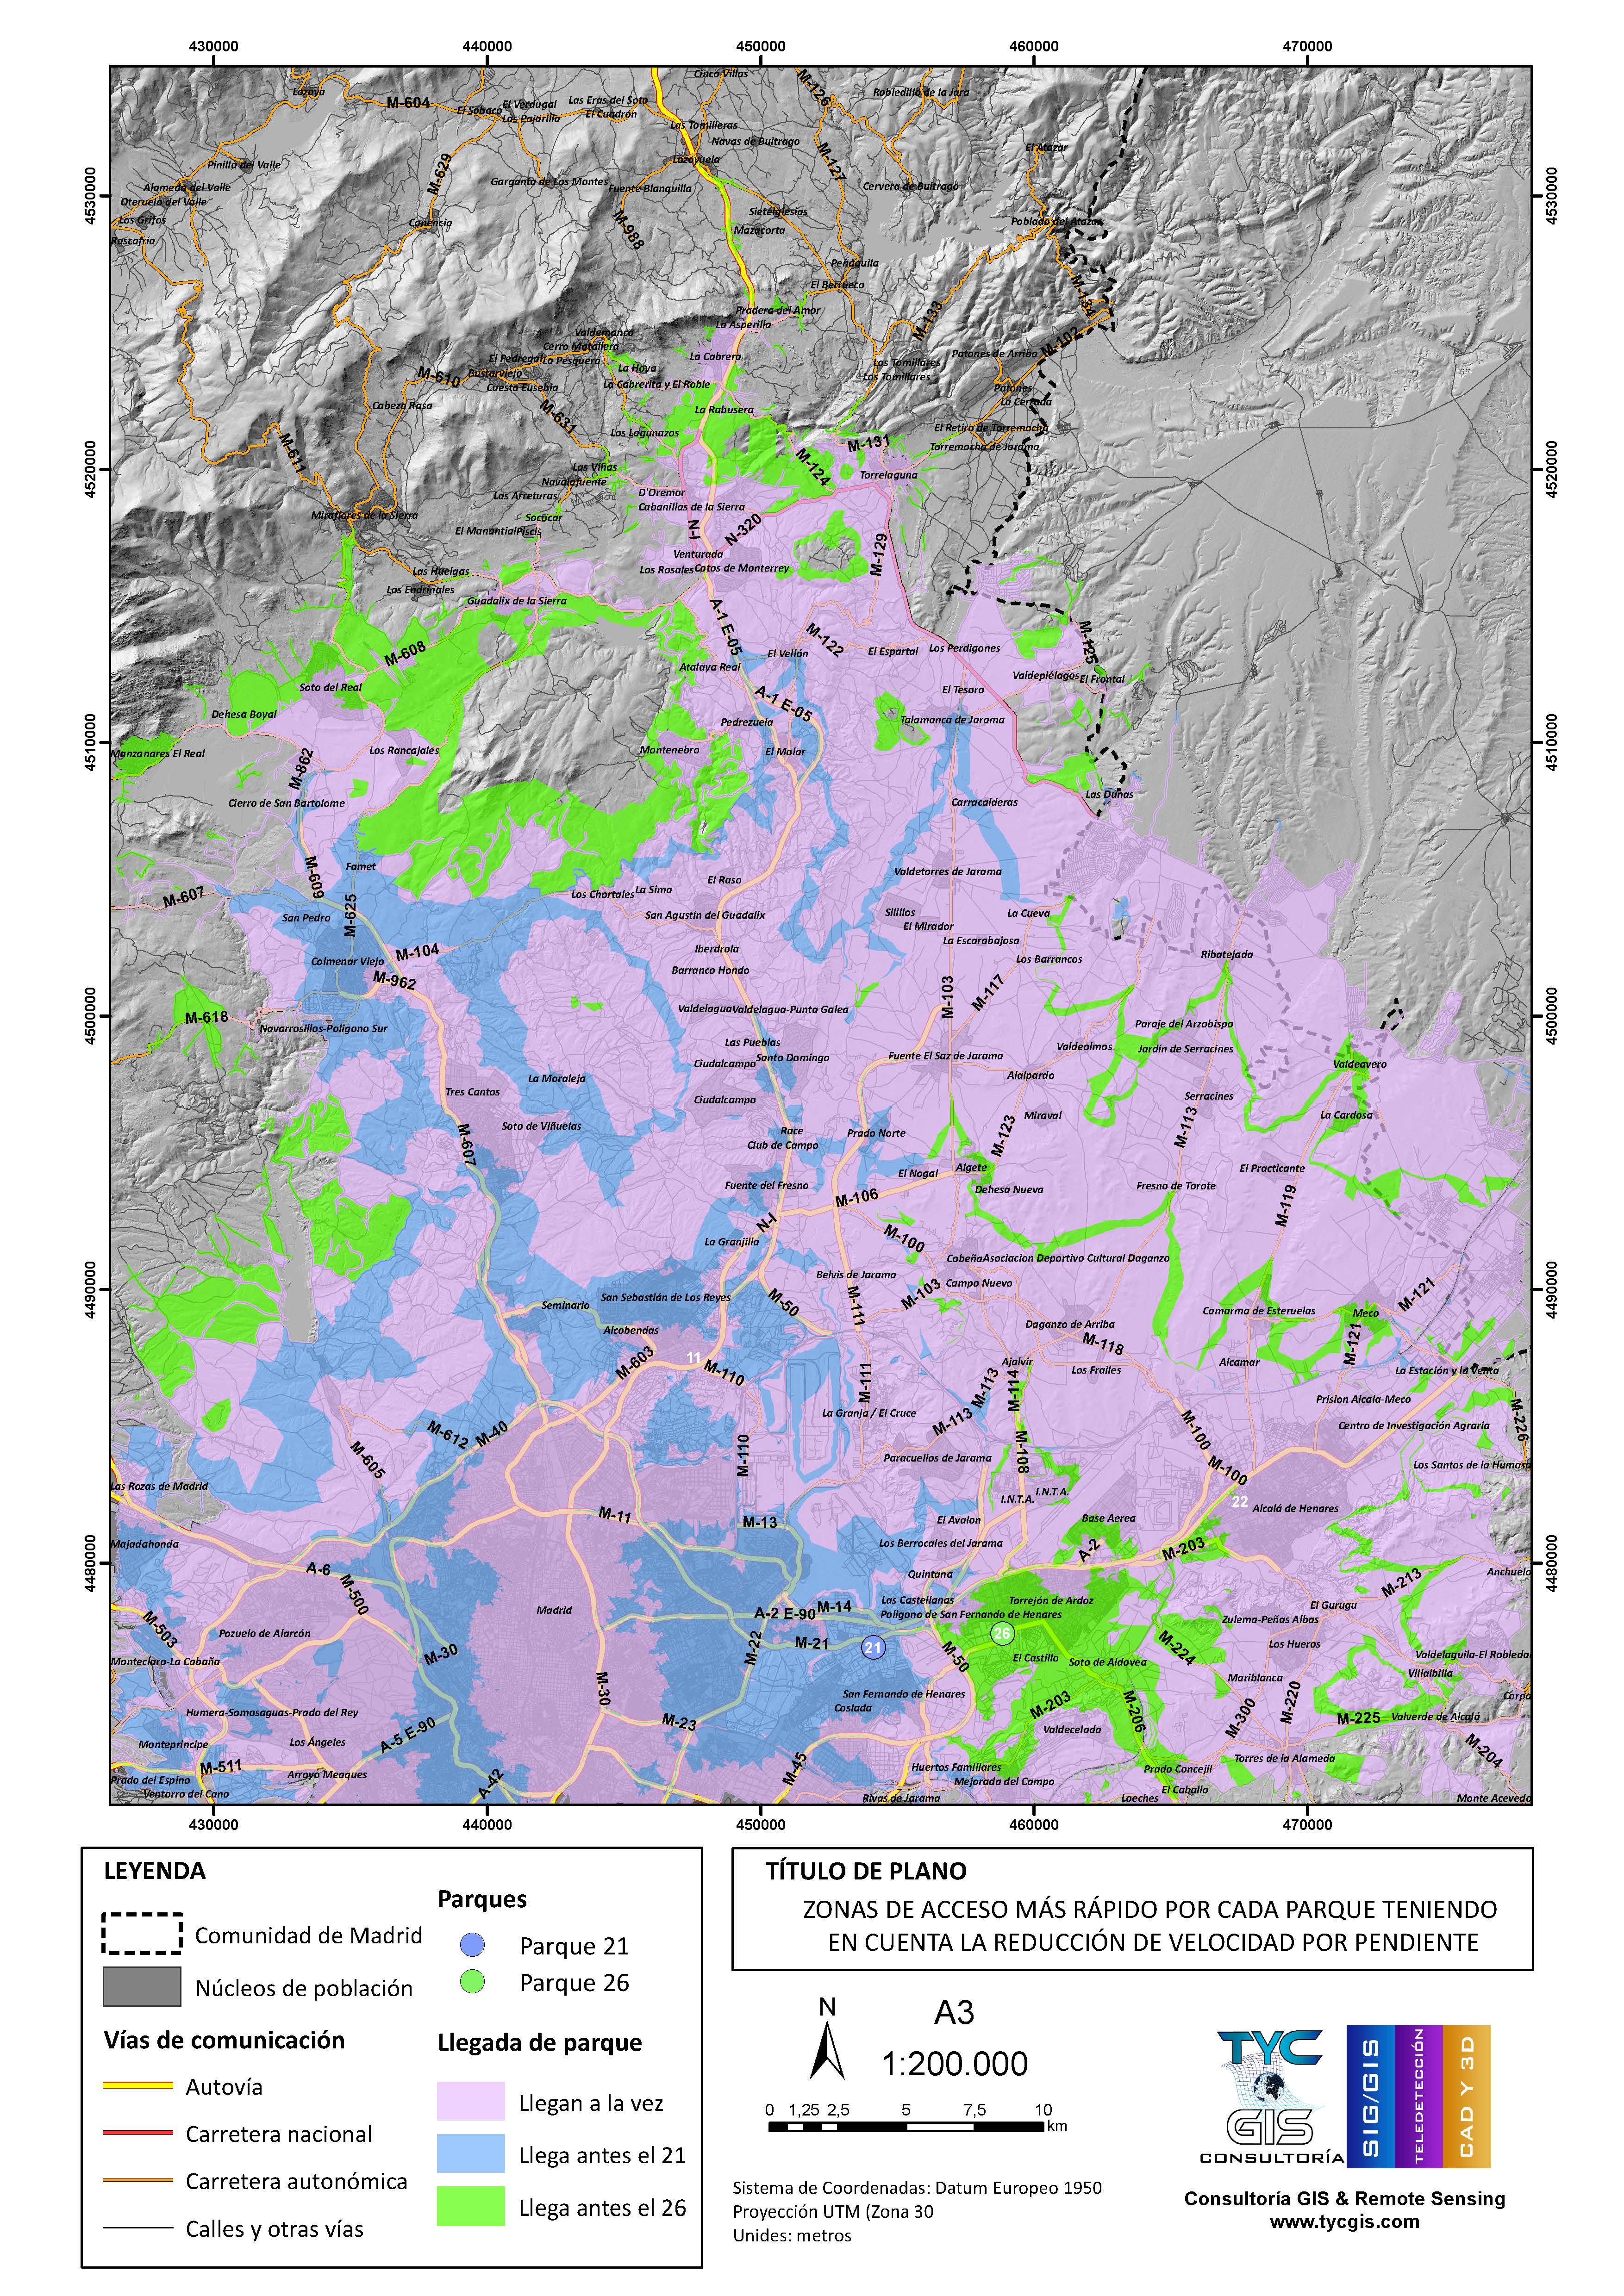
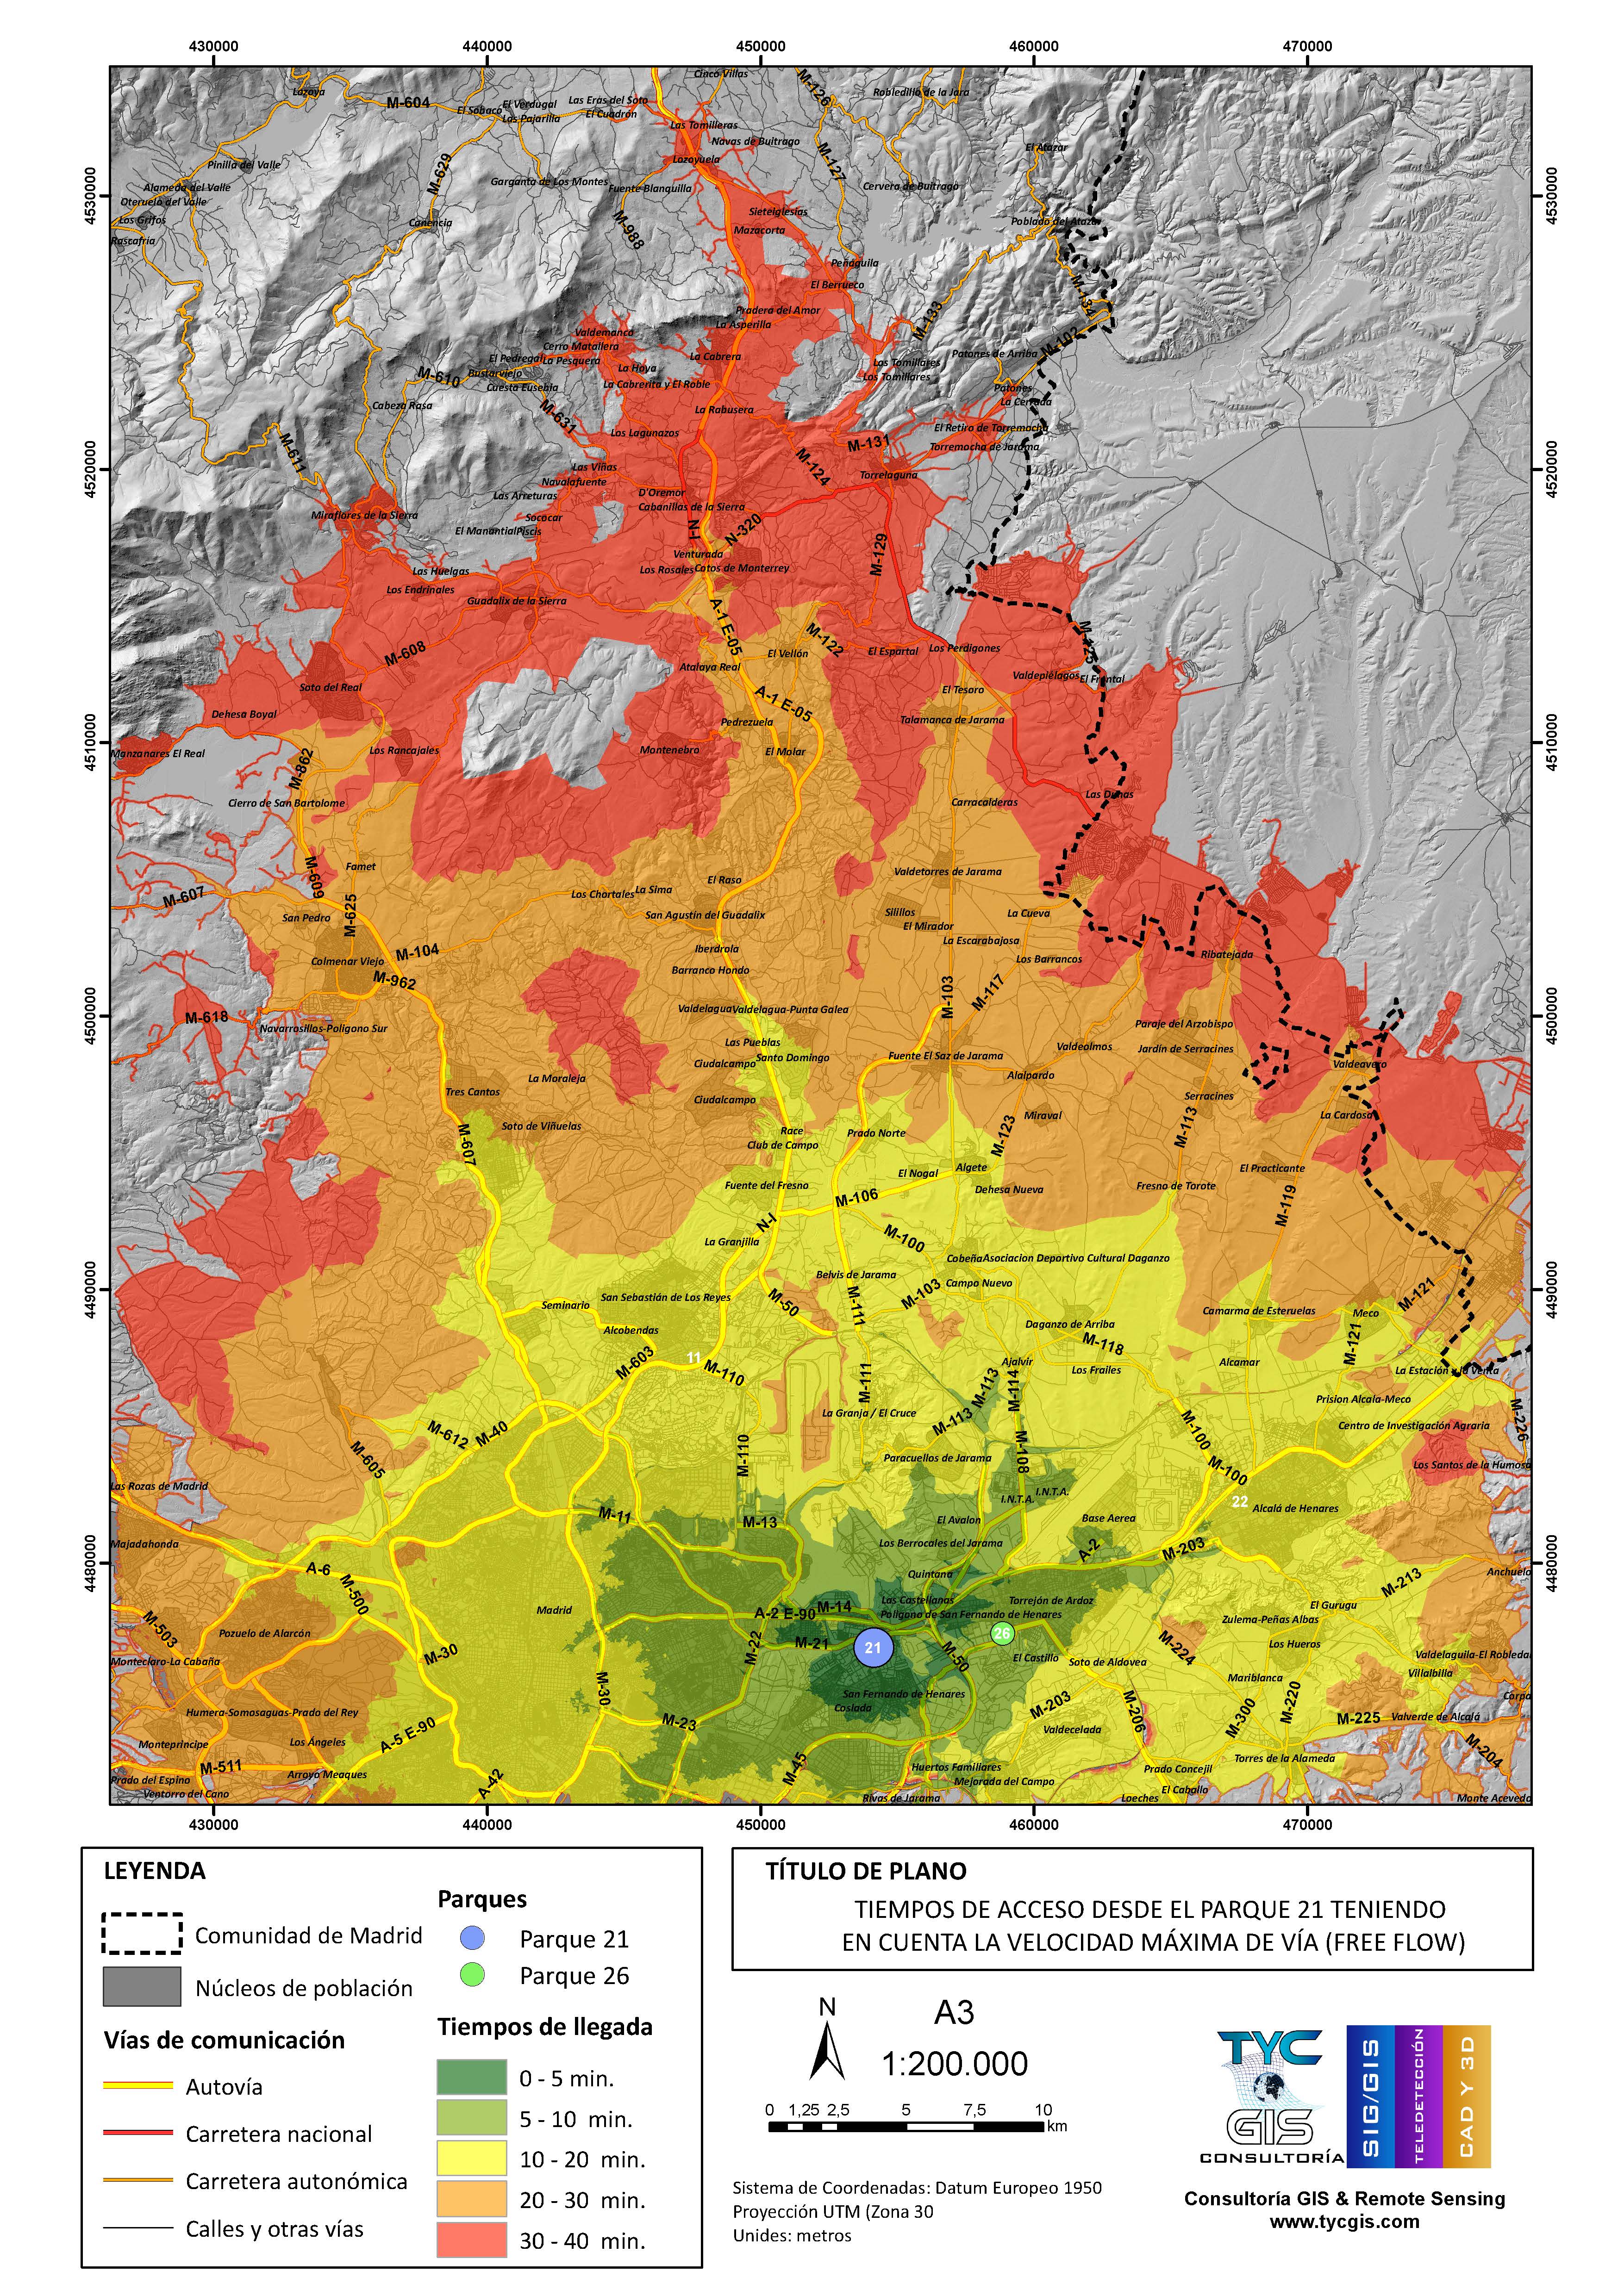
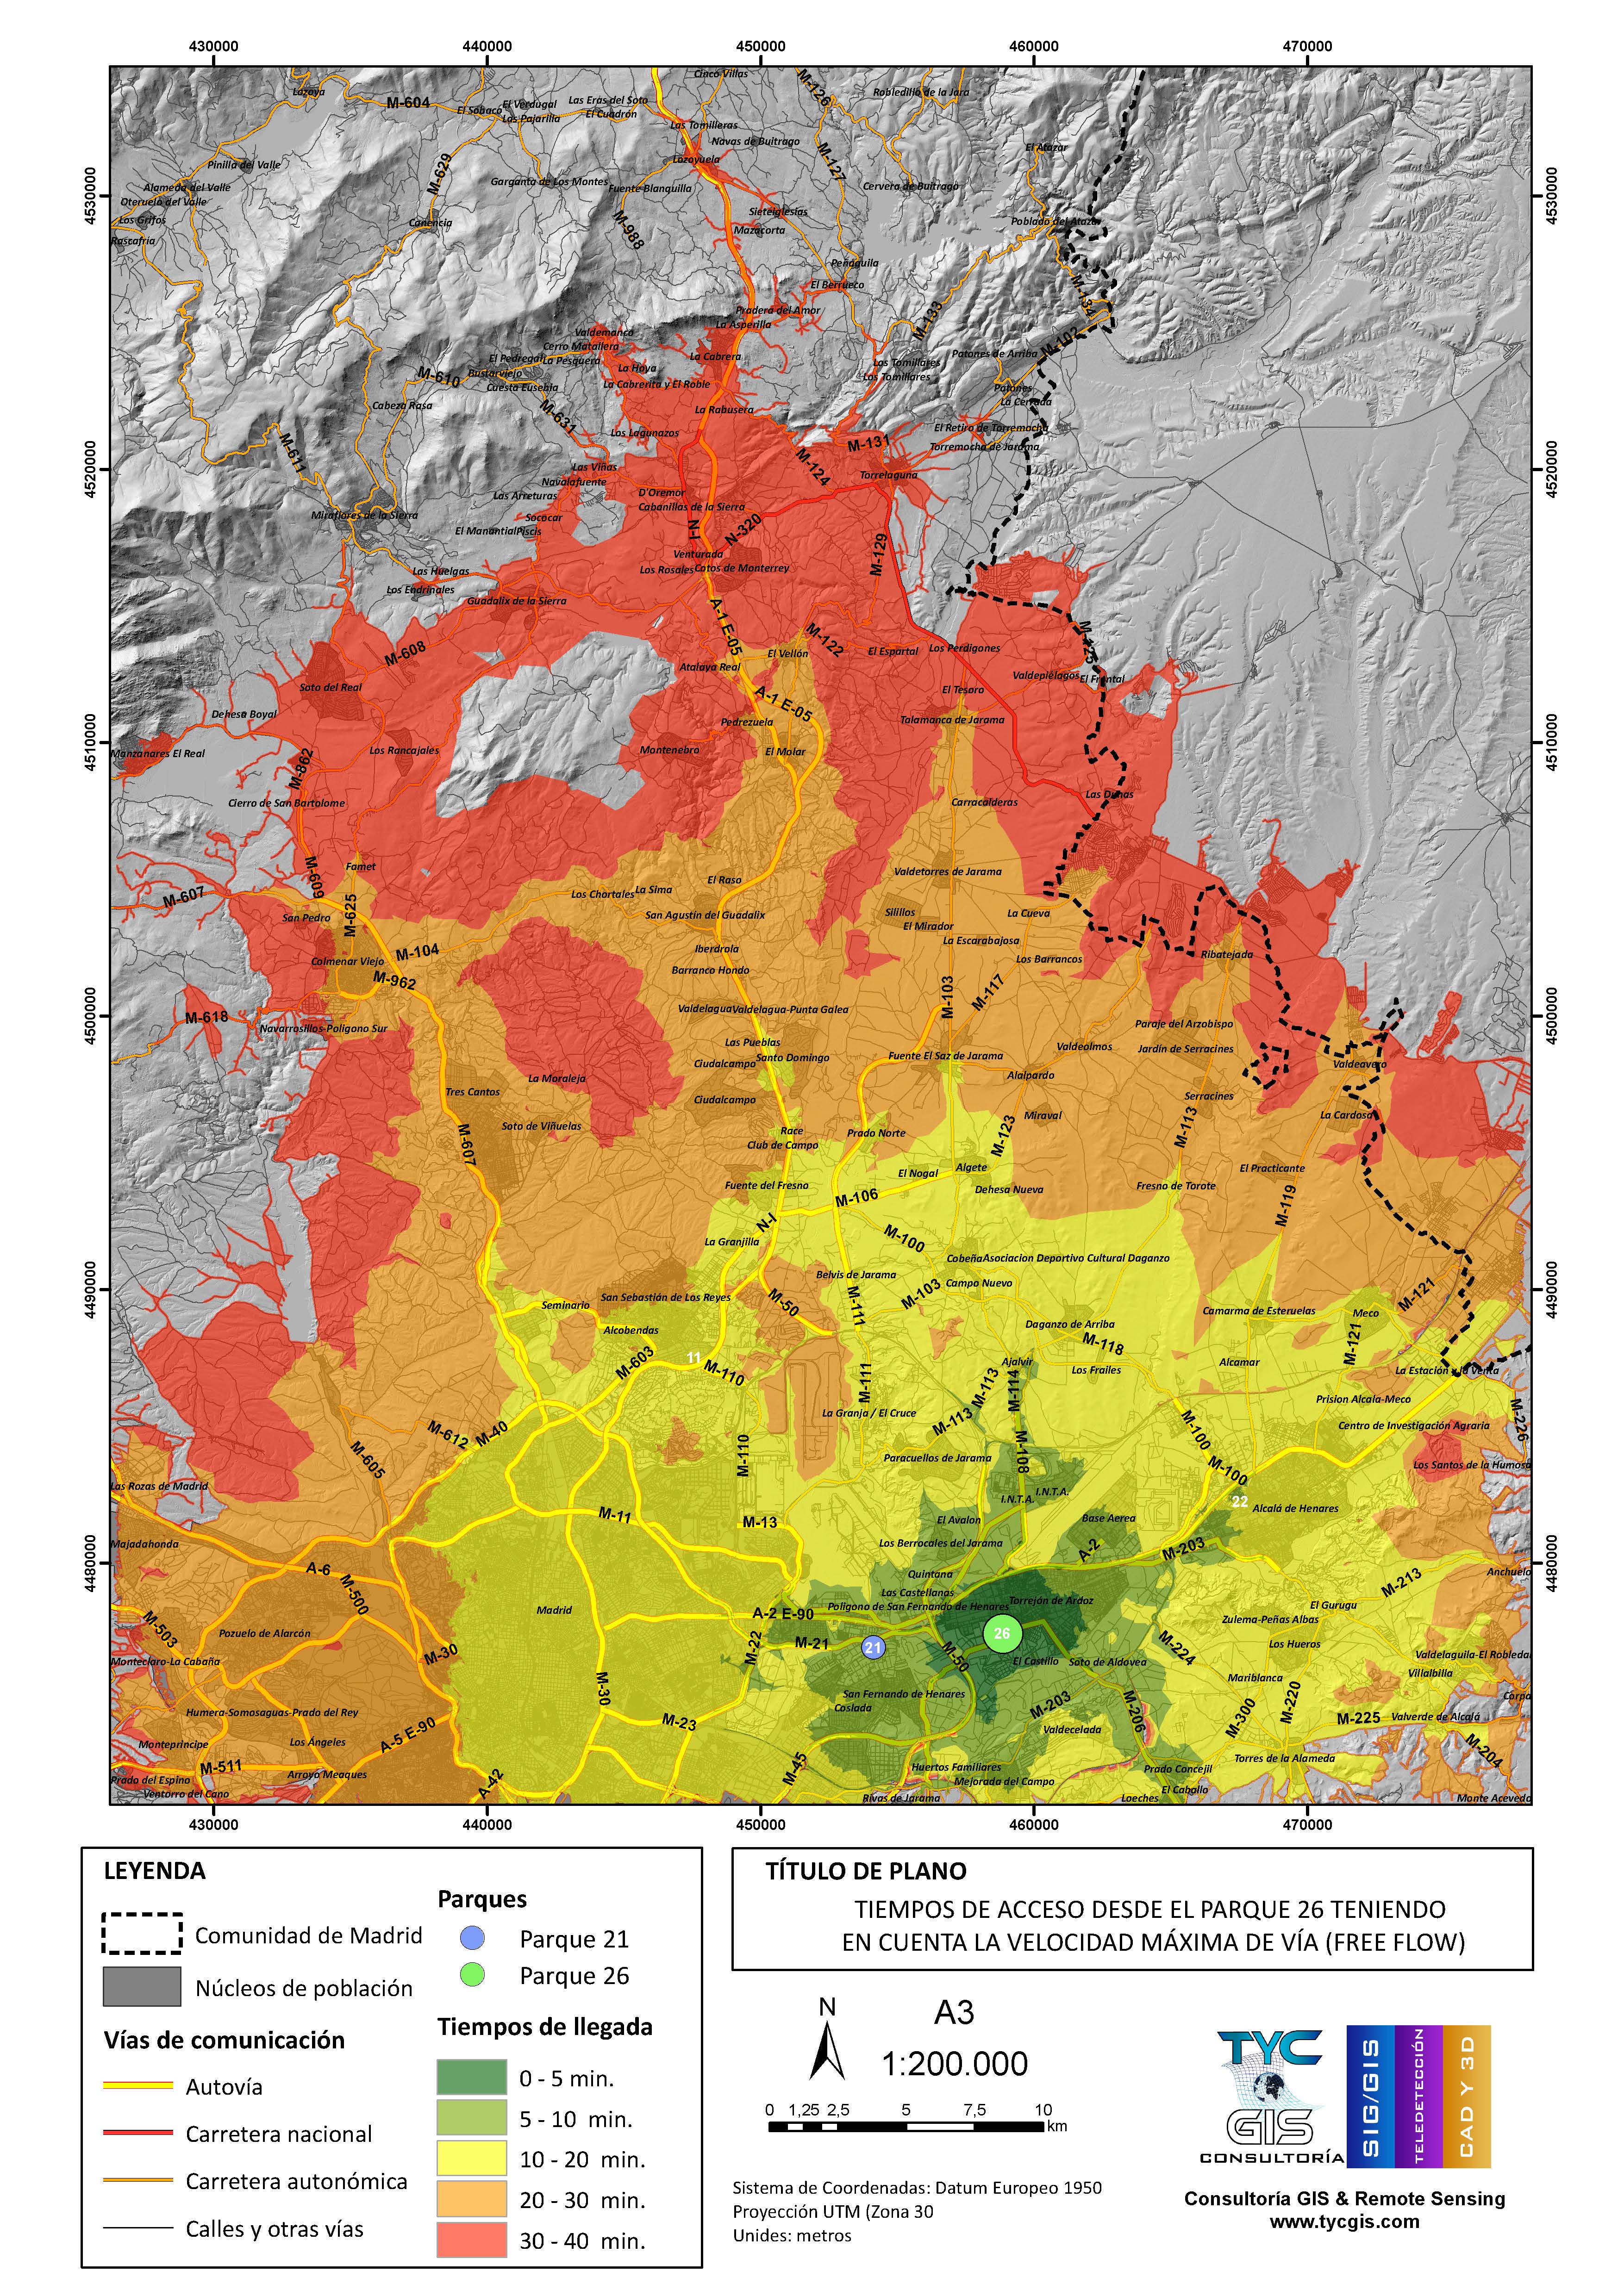
Pilot study to advise the Community of Madrid Fire Department on the design and assignment of intervention zones to each center using Network Analysis of ArcGIS (ESRI).
In this study, the times of access of a series of intervention centrals were analyzed. With the analysis of accessibility according to type of road, max speed of the truck and turning restrictions, results were compared accounting and not accounting the effect of the slope on the speed reduction and, therefore, the delimitation of the intervention zone for each station.
Customer: Community of Madrid – Fire Department
Year: 2015
Amount: Confidential.

