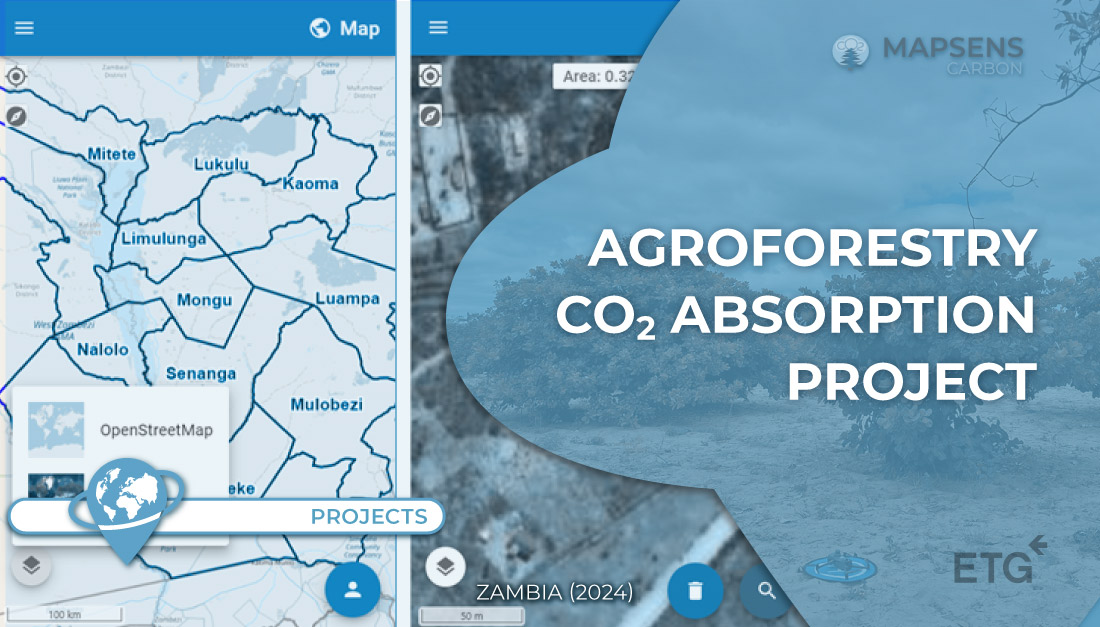
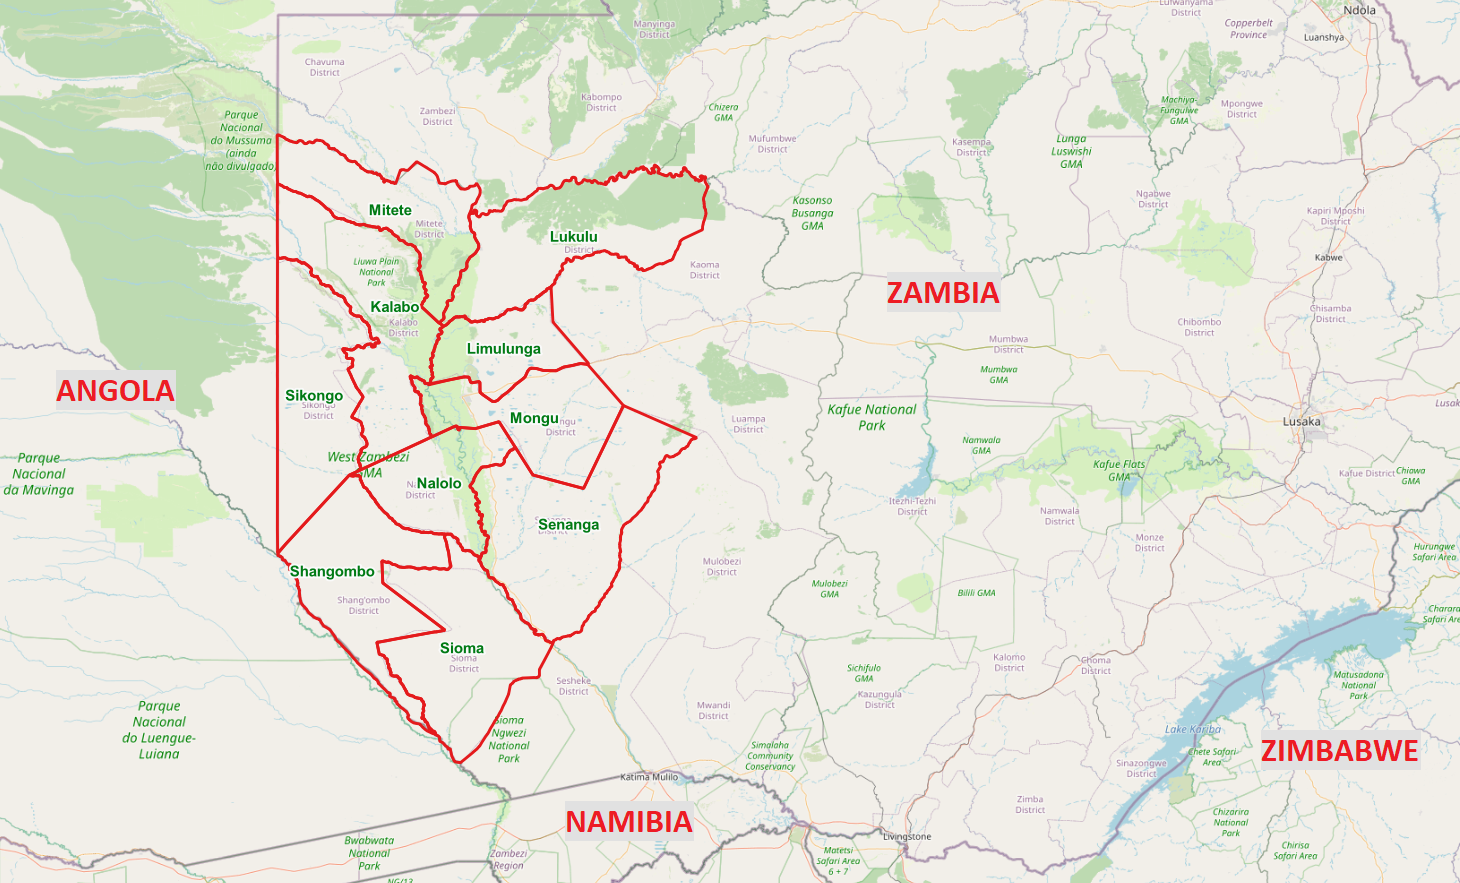
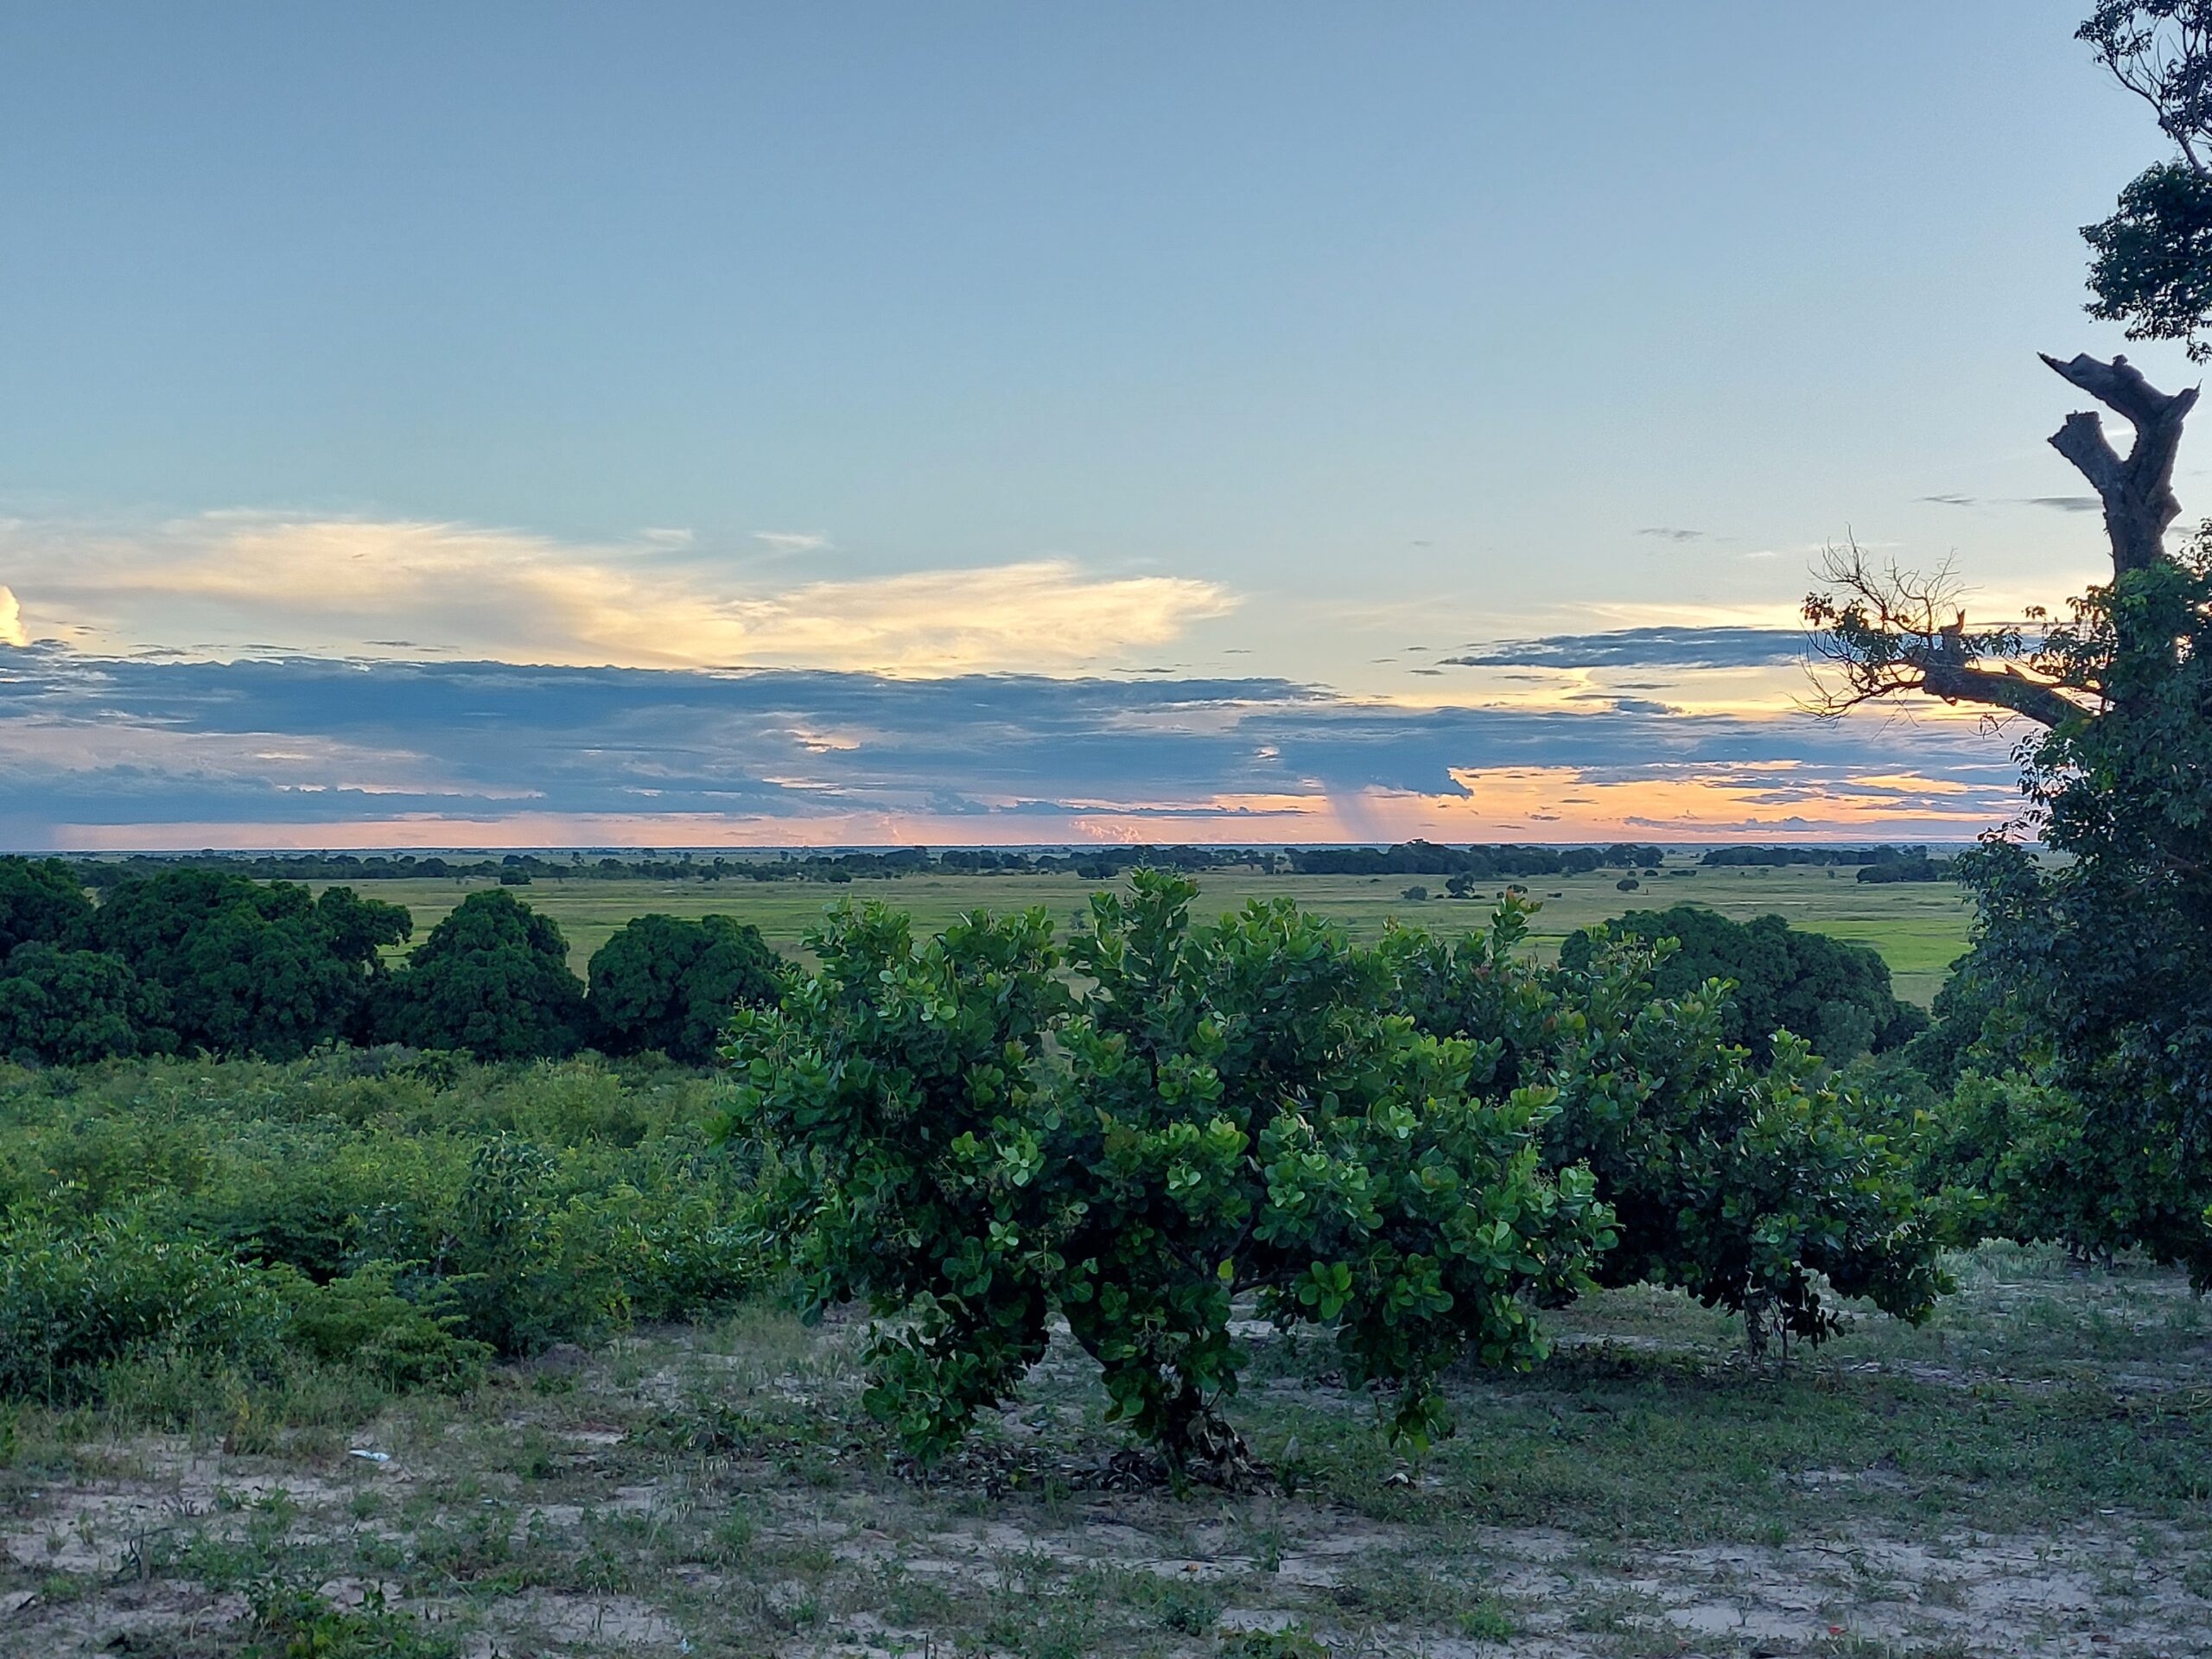
At TYC GIS we have worked the last months in a agroforestry CO2 absorption project carried out in 10 districts of the western province of Zambia by the multinational company ETG, specialized in the trading of agricultural products.
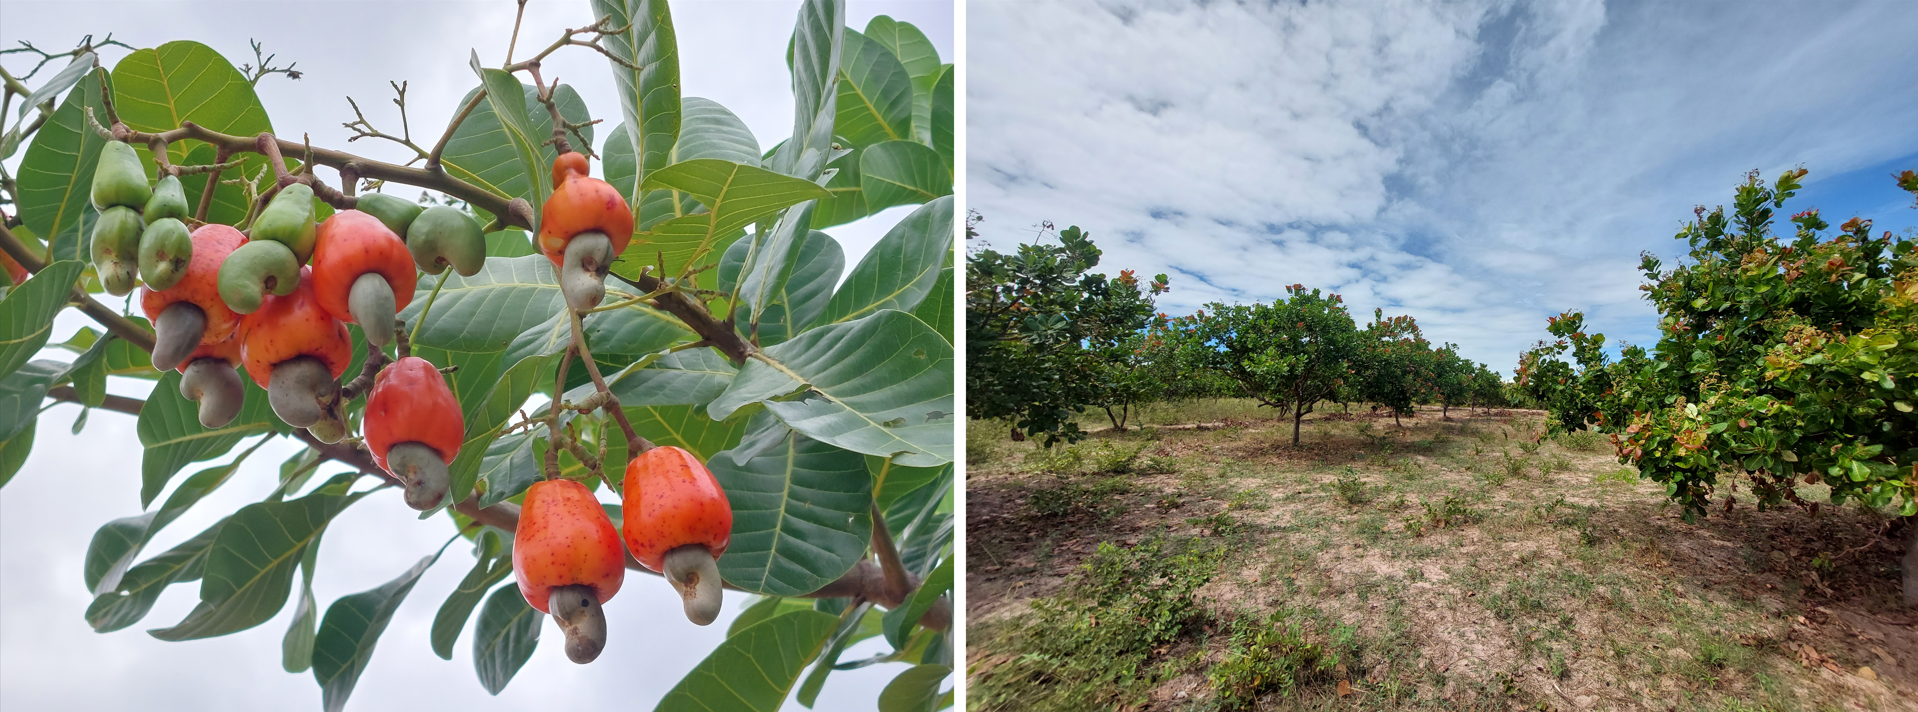
The project, at its current stage, has consisted on the planting of aproximately 120.000 cashew trees (Anacardium occidentale) distributed betweeen 1700 plots dedicated to subsistence agriculture that sum up more than 2000 hectares of surface area. Besides them, further extensions of the project are planned, that will make these numbers to grow in the future.
The trees we delivered during the 2019/2020 plantation season by ETG to those farmers who previously offered their plots for plantation, therefore this project having also a strong social component that improve the living conditions of the local population, since farmers can gain benefit from the sale of cashew nuts.
After 4 years since the trees were planted, work began to apply for the project validation and the first verification of the carbon credits generated to the certifier body. It is during this process that ETG has relied on the services provided by TYC GIS.
Work carried out
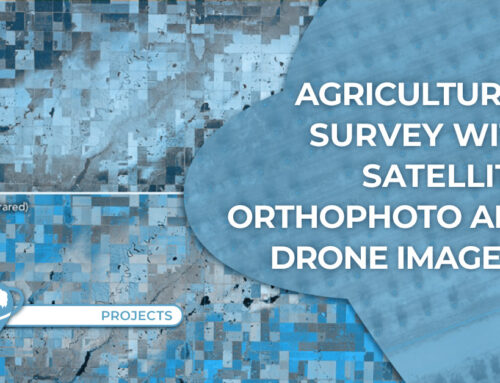
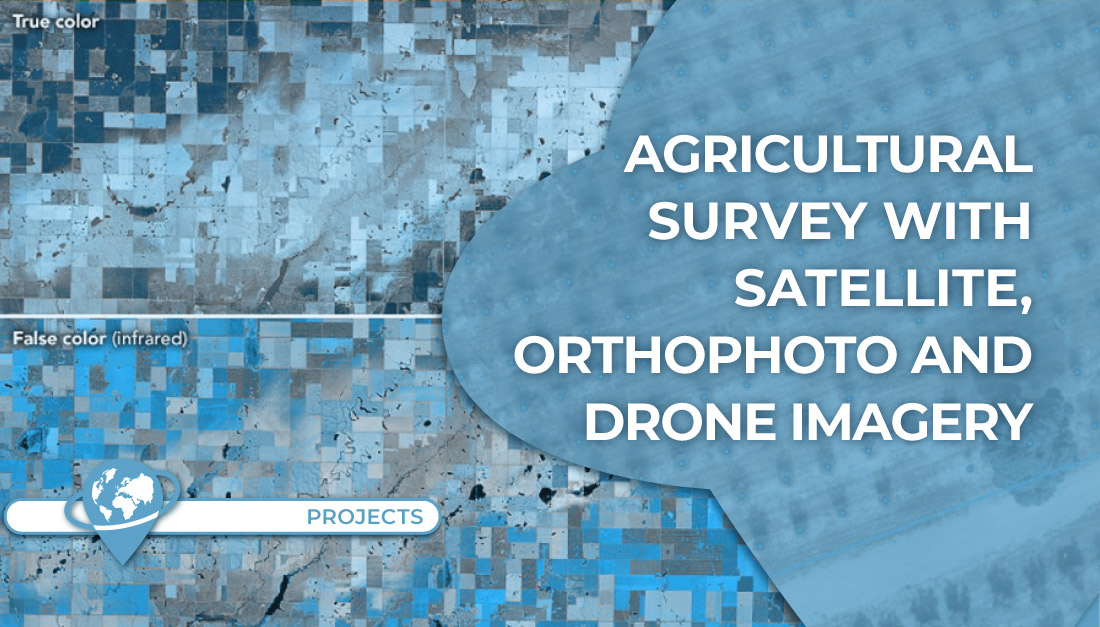
1. Project surface mapping
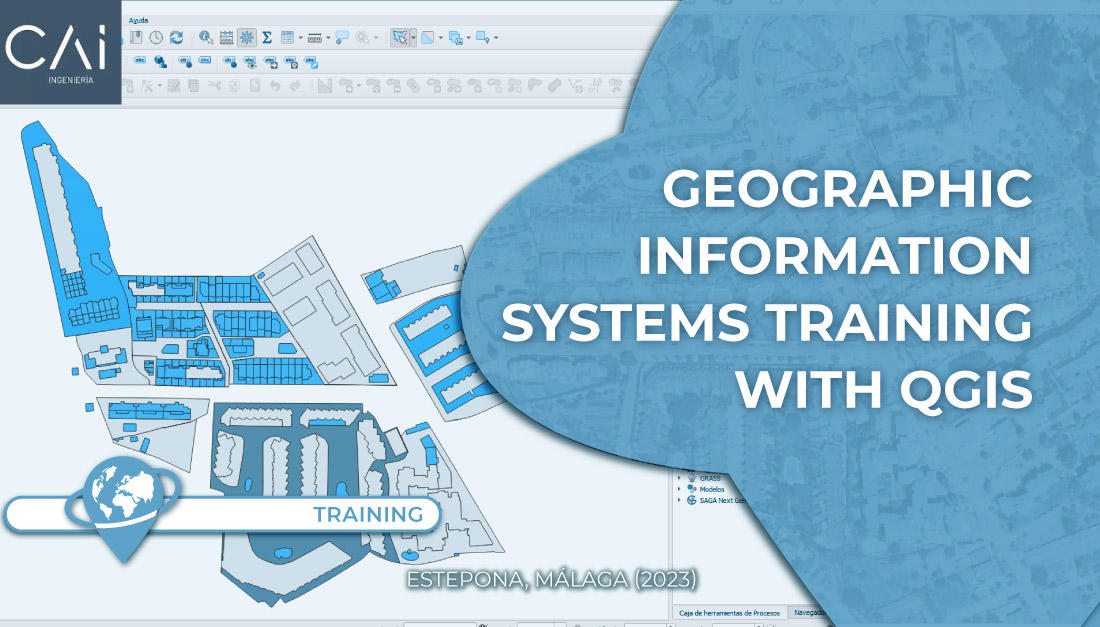
The first work consisted on the mapping of the surface area of the project, this is, digitise all the planting plots so their geometries can be used on GIS.
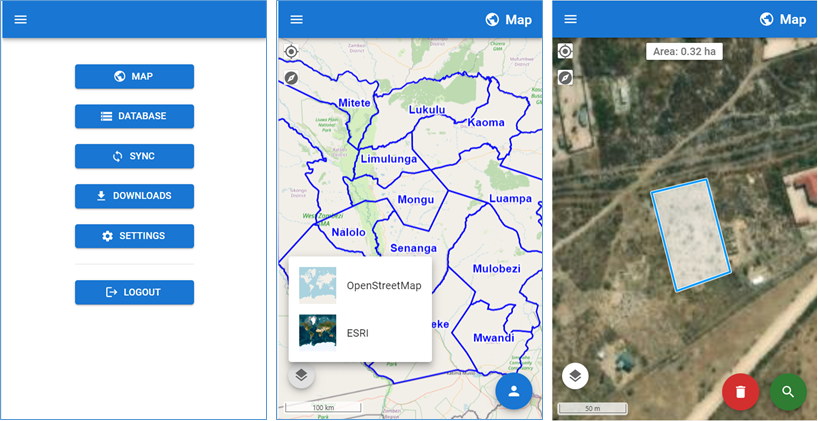
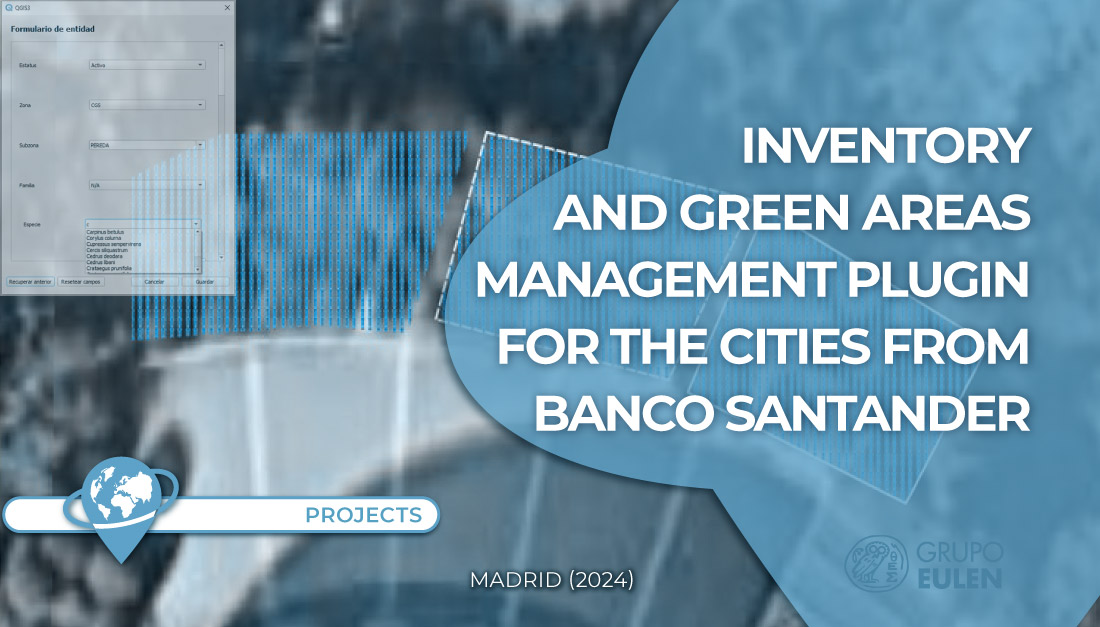
To undertake this work, TYC GIS developed its own mobile app with all the necessary tools to digitise on the field the plots and to include all the data that was considered relevant.
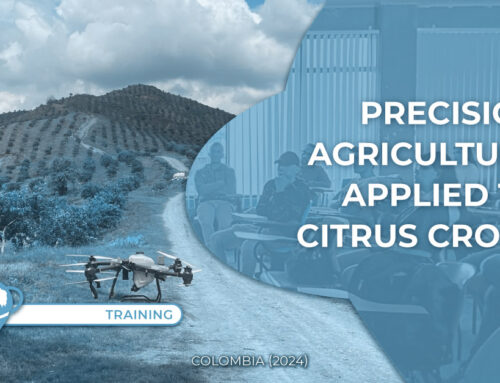
The digitisation of plots was carried out by a local ETG team consisting in 12 field digitisers who were previously trained on the use of the mobile app by a TYC GIS team. This training was carried out face to face in the classrooms of Namushakende agricultural training centre, located in the Mongu district, where the capital of the west province is, and also closeby to some planting plots so they could practice what they learned.
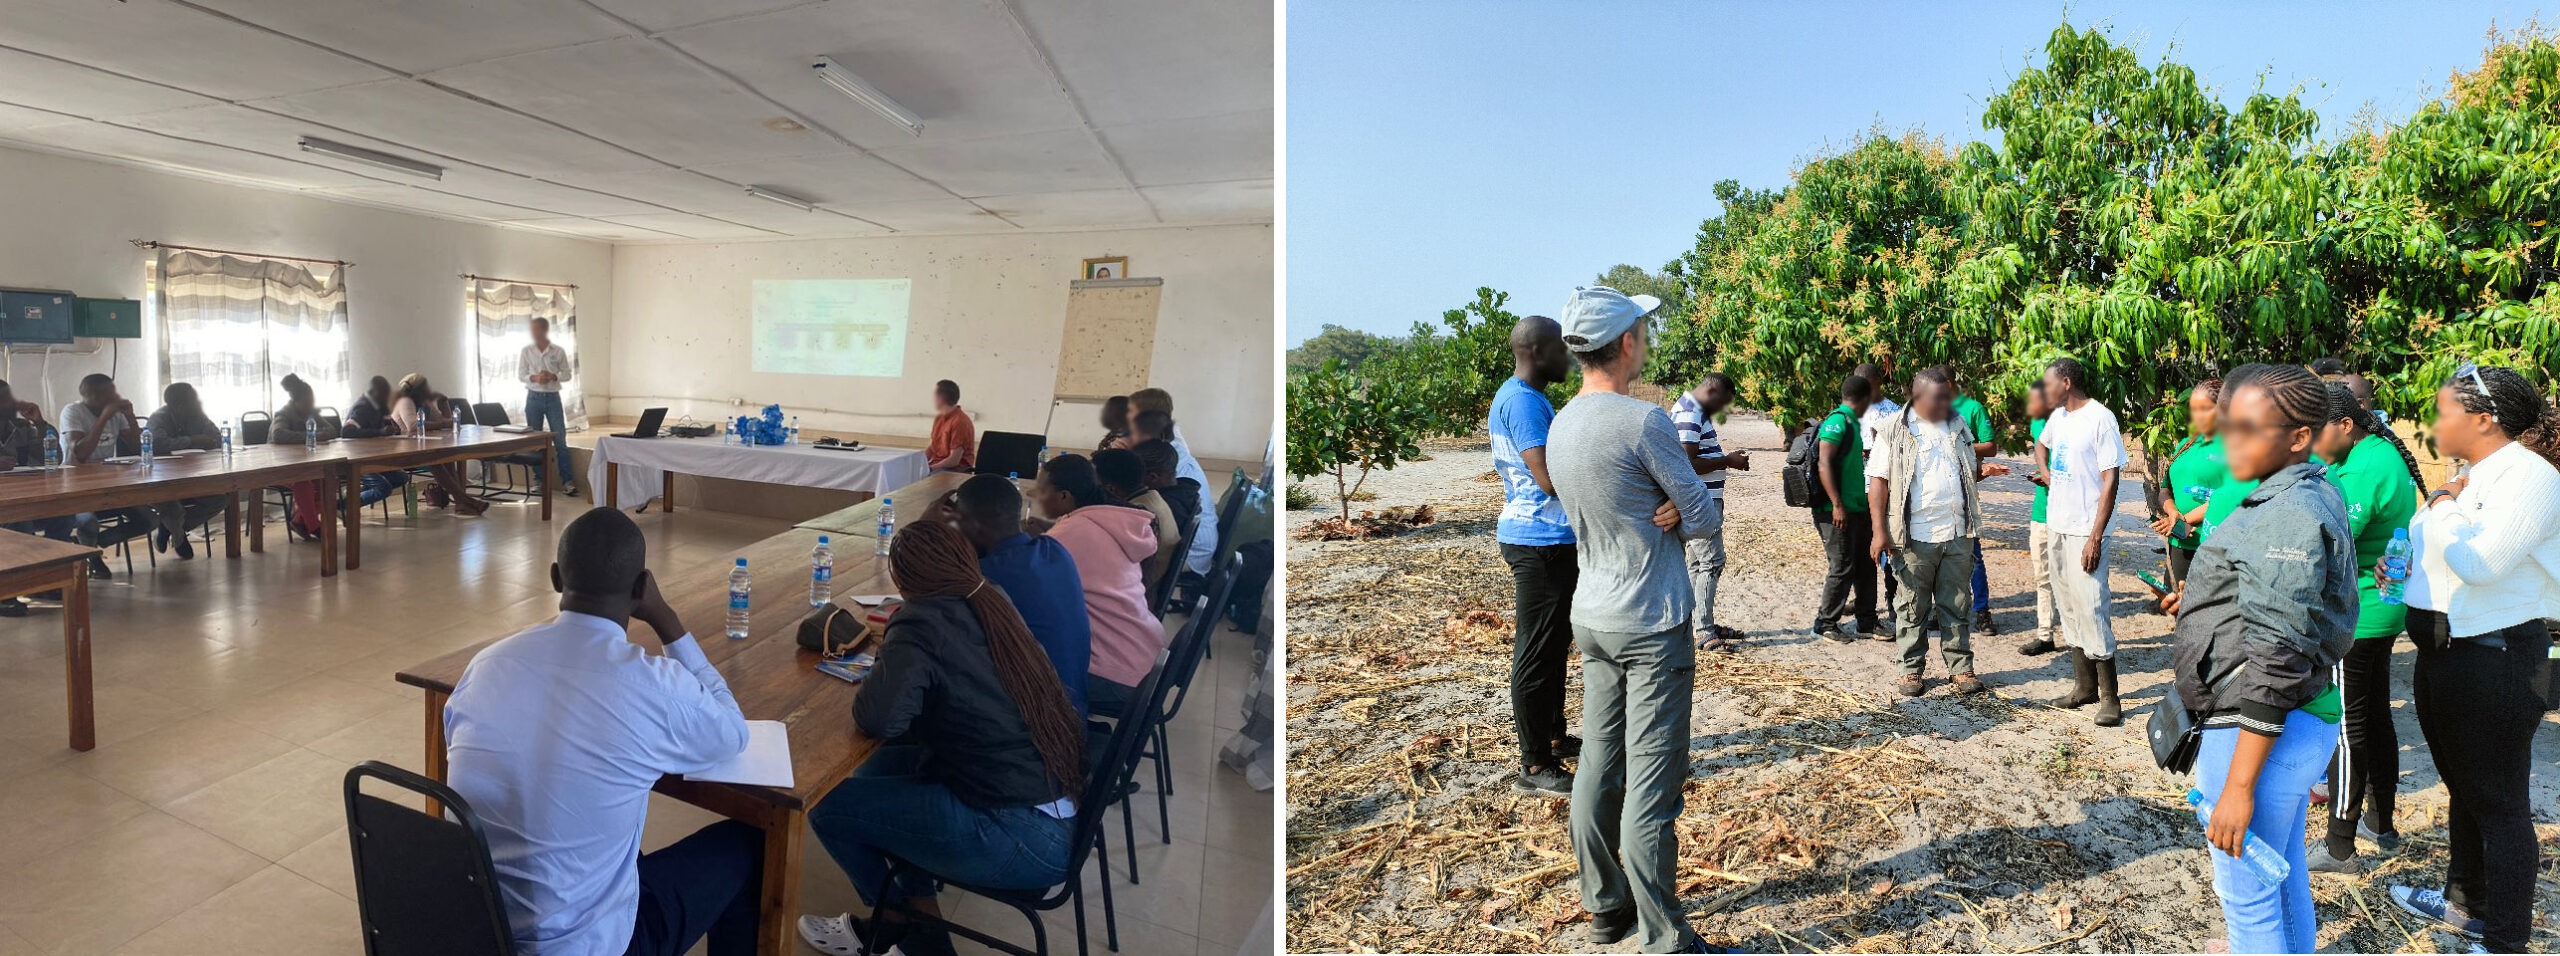
Once the digitising process started, all the simultaneously produced information by the 12 digitisers, was stored in real time in a spatial database connected to the mobile app and created specifically for this project. This database was also reviewed daily by the TYC GIS team in Spain to issue reports and to produce all kinds of statistics and graphical elements on the digitisation.
2. Mapping review
As the digitisation process progressed, TYC GIS team was carrying out a detailed and indepth review of the results. This review was carried out based on current high definition satellite images and consisted on the supervision and possible modification of the geometries, error removal and classification of each plot into 5 different tree density classes towards the project stratification.
3. Field sampling
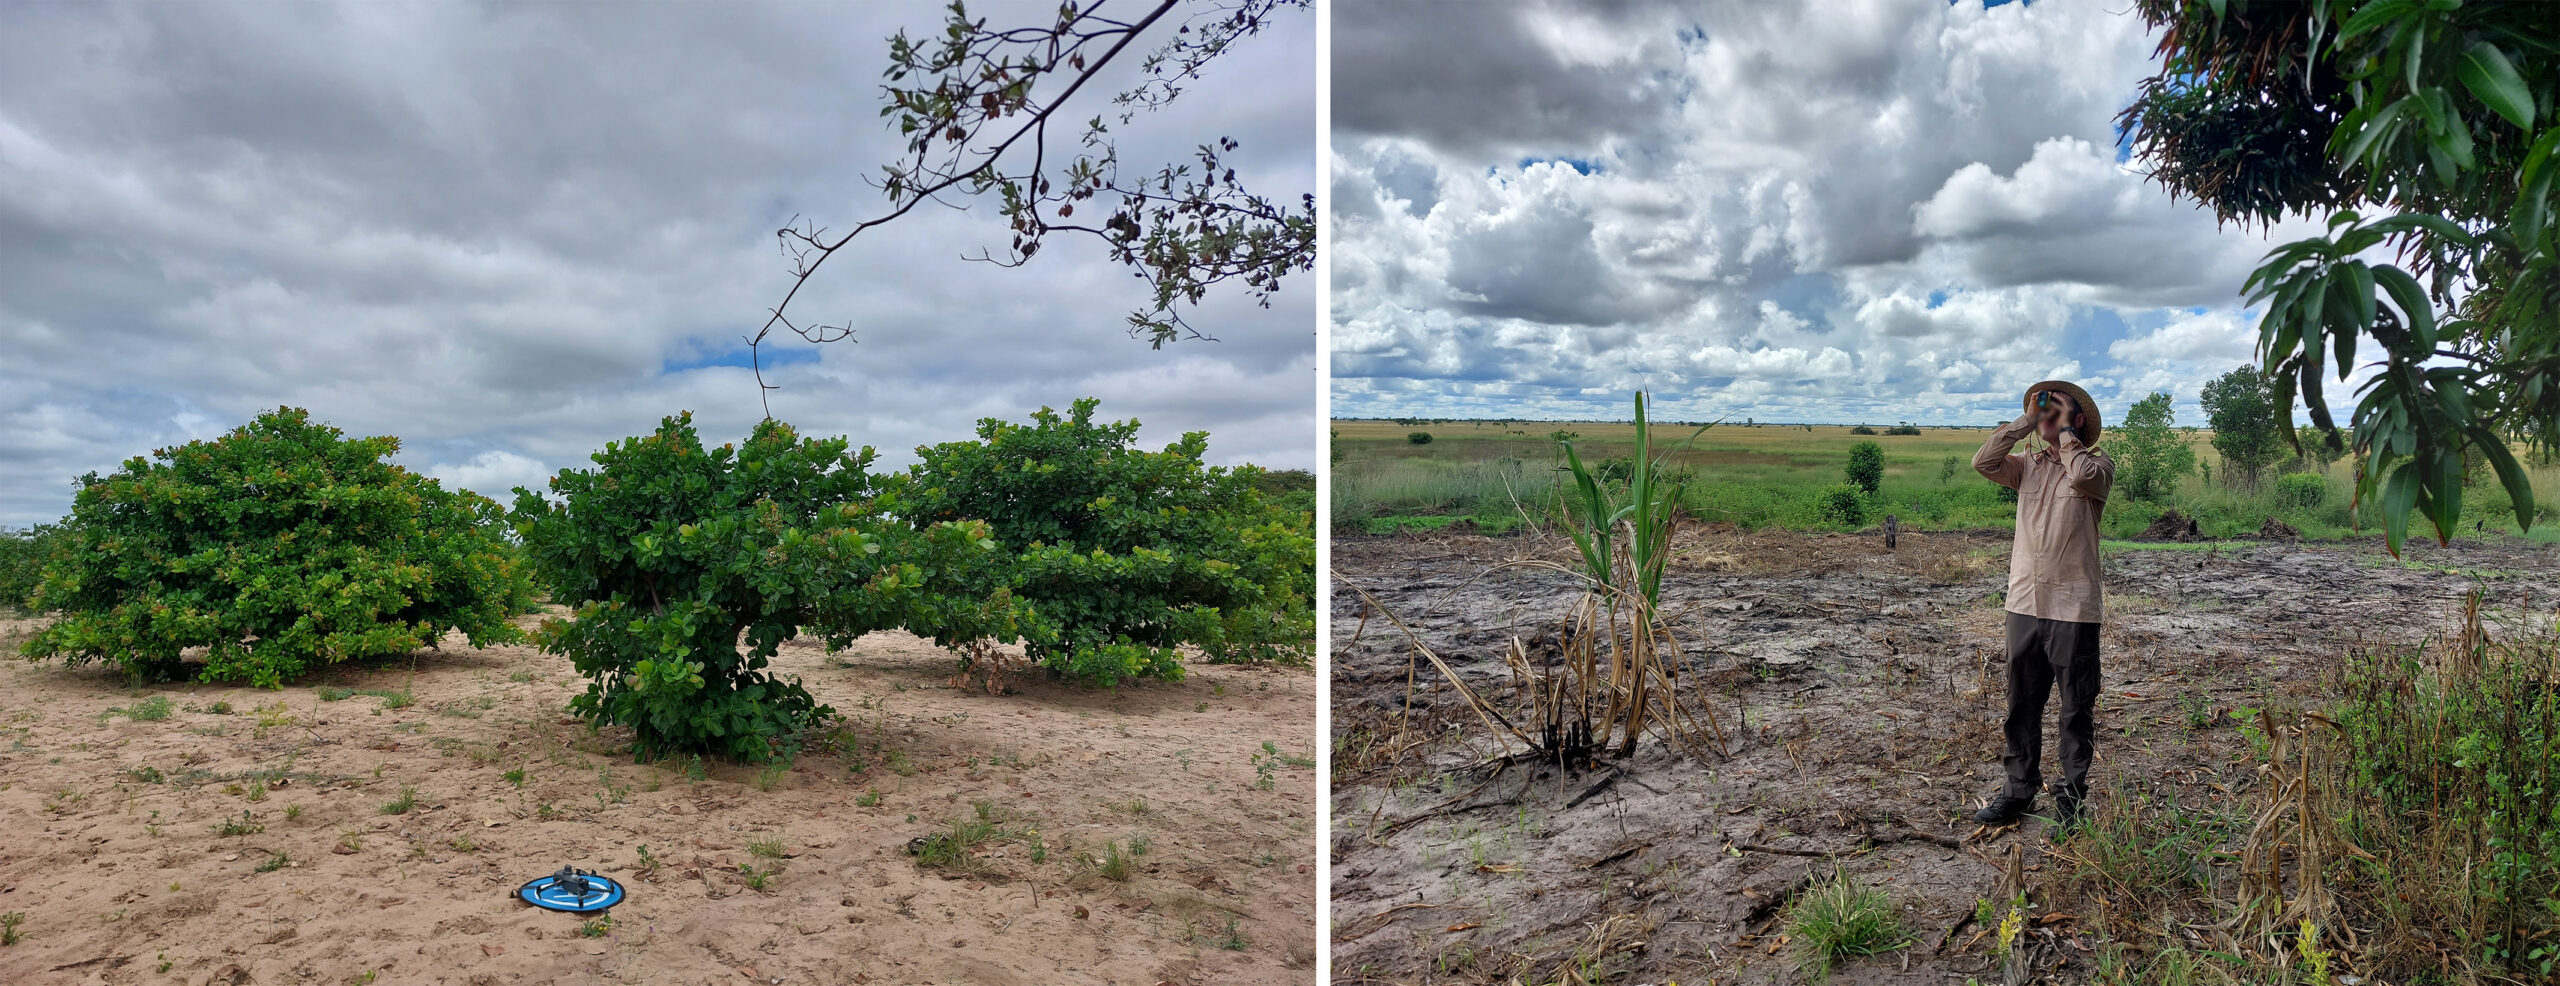
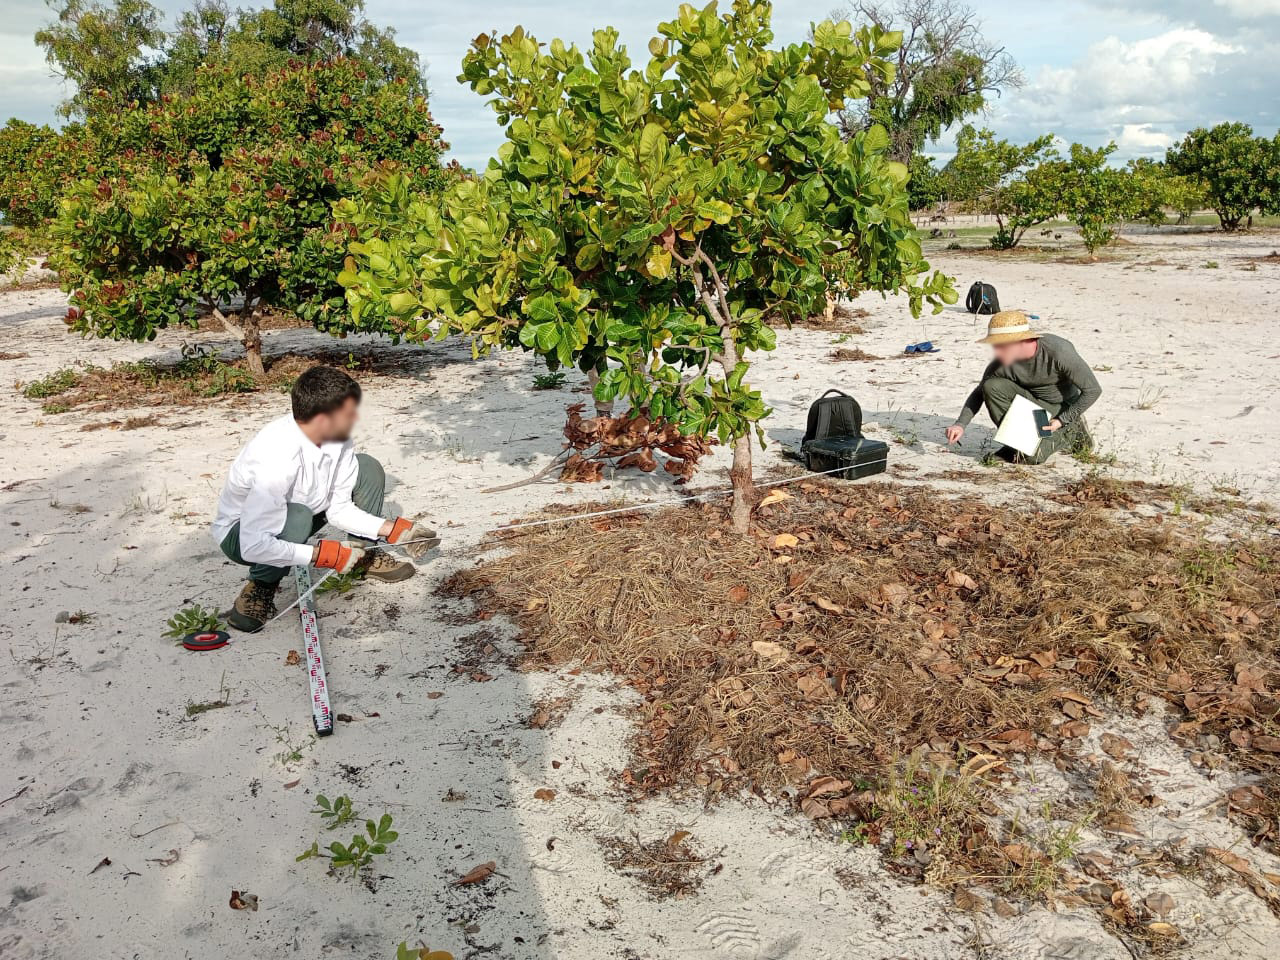
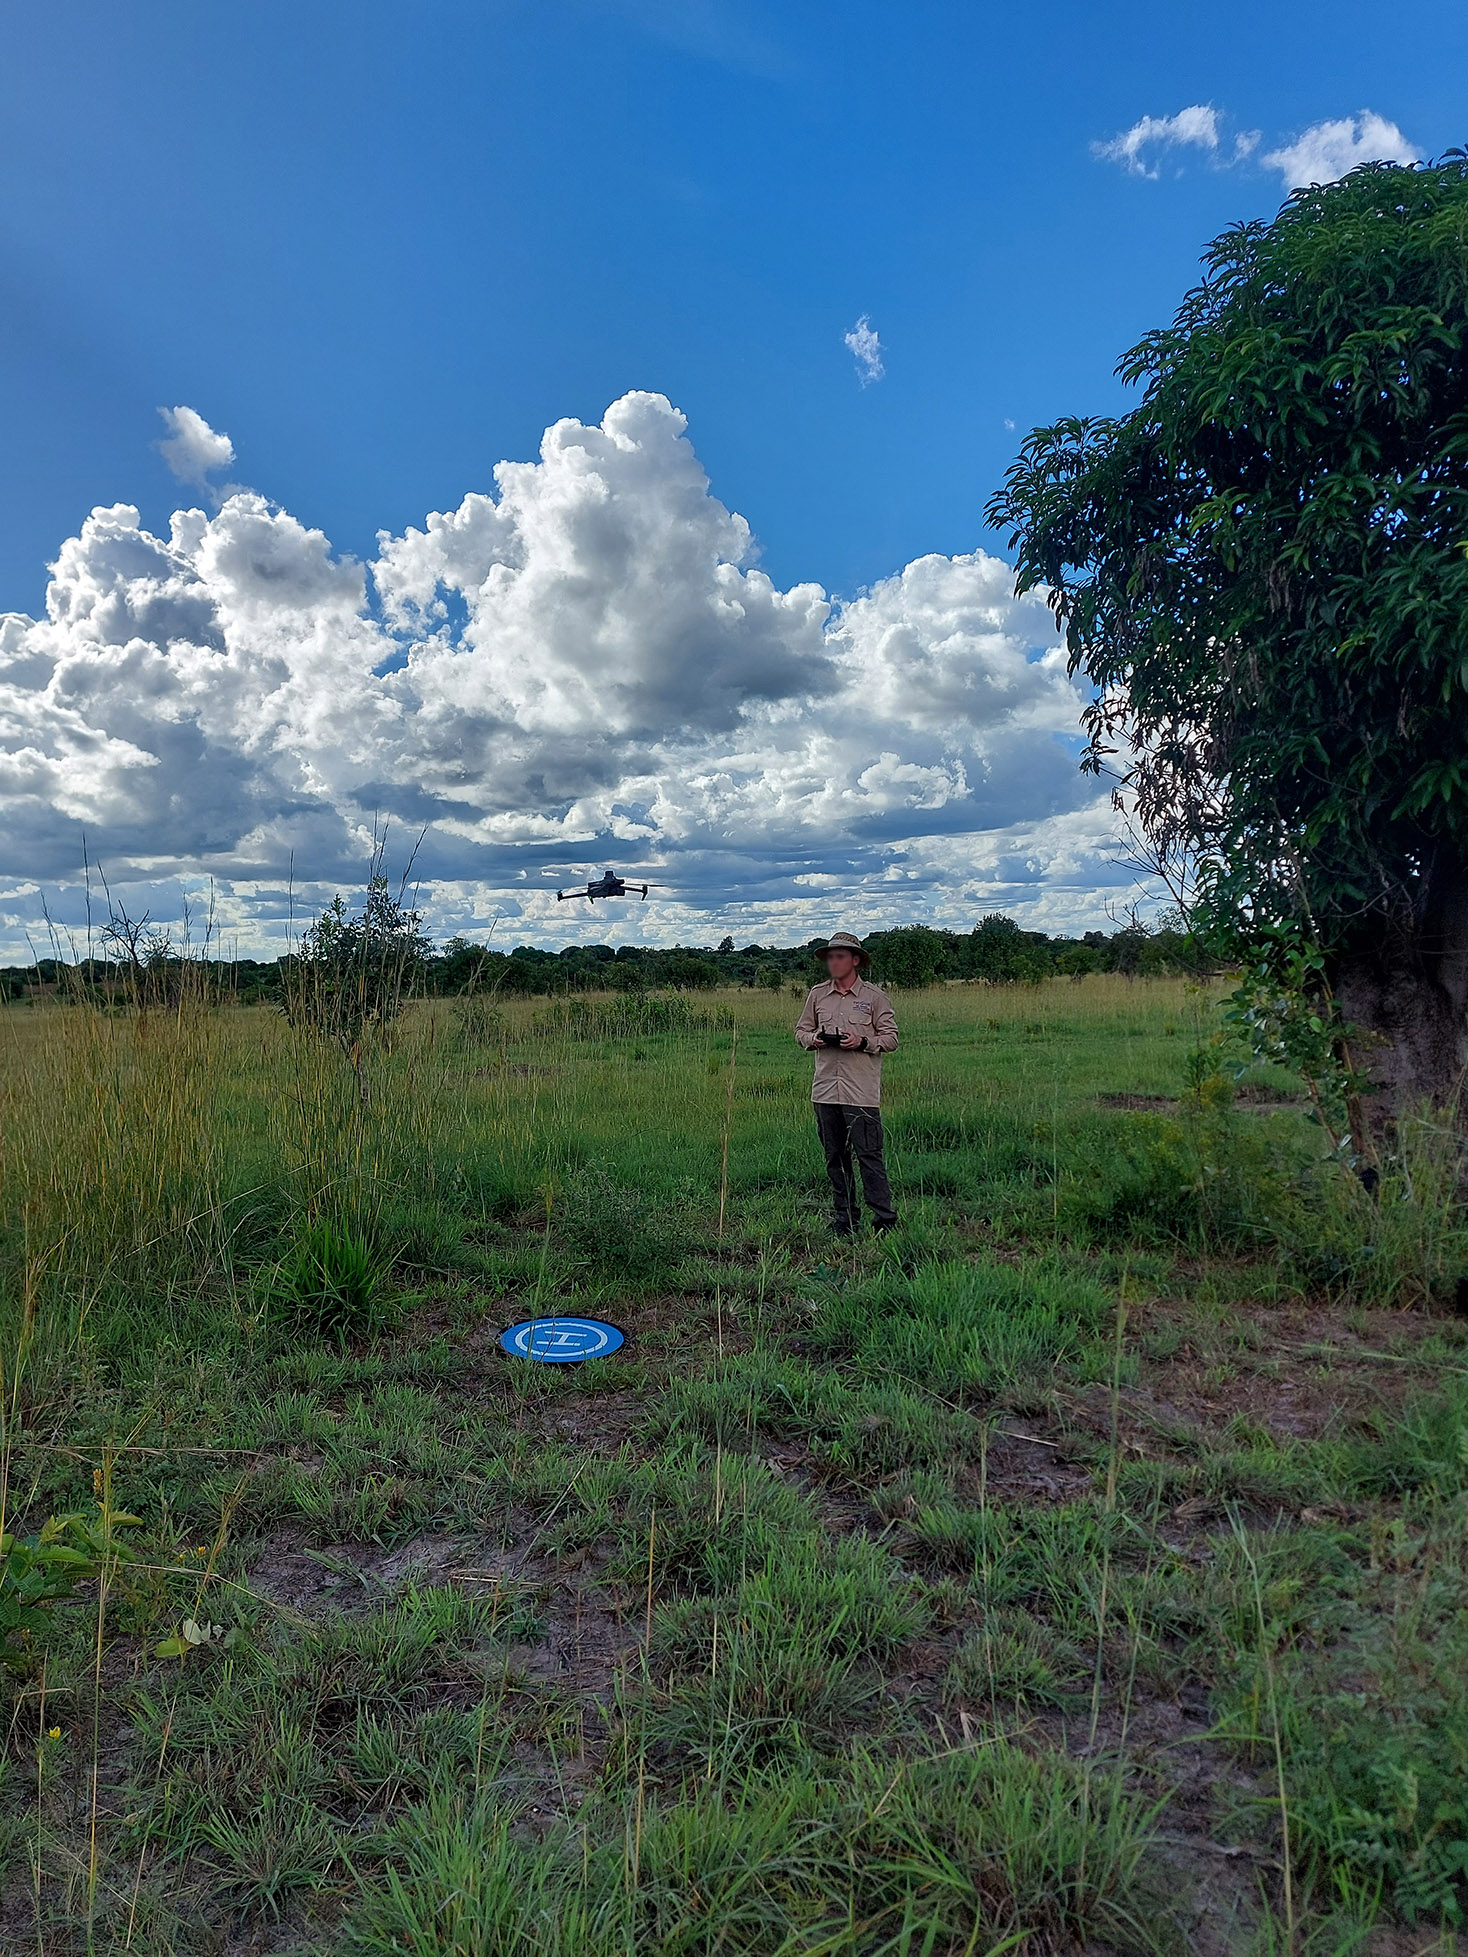
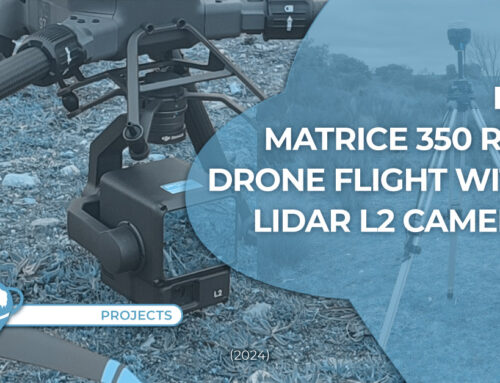
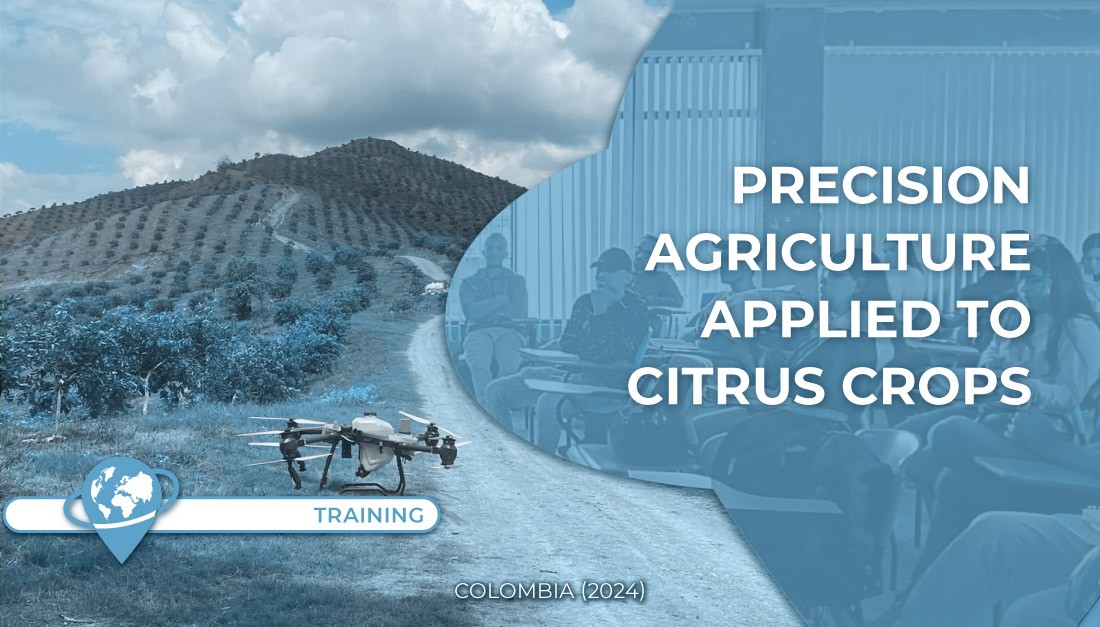
Once all the plots were digitised and checked, the field sampling was designed to quantificate the carbon present in the planted trees. This sampling consisted in a traditional forest inventory with field measurements in sample plots and on photogrametric and multispectral drone flights towards the monitoring of the trees condition and the measurement of the morphological parameters of the trees.
The chosen method for the forest inventory was the stratified random sampling. The stratification consisted in the plot classification in 5 classes according to the density of the trees present in them, and, after calculating the number of plots to sample for each class, their random location within the area occupied by each class was carried out.
After the design of the sampling phase, two TYC GIS teams traveled to Zambia to carry out the field sampling. Samplijg plots were located and measurements of different morphological variables were taken on all the trees located inside them. Besides that, all the surface area of the planted plots where sampling plots were located was flown with a drone in order to obtain photogrametric and multispectral data.
4. Absorption calculation, baseline, additionality and CO2 final balance.
Once back in Spain, the calculations of the CO2 absorbed by the planted trees during the period to verify in the more than 2000 hectares of the project was carried out, thanks to the measurements taken in the field.
But this is not all, it was also necessary to calculate the possible carbon losses due to wildfires, as well as the carbon that would have been absorbed in the surface area currently occupied by the planted plots if this planting had not been carried out. The latter is known as project baseline.
Both calculations were carried out through remote sensing techniques and GIS operations. In the baseline case, the methodology used for the carbon credit certification required a procedure known as “Performance Benchmark” to be carried out. This is a dynamic method based on the calculation of a remote sensing index related to the stored carbon on a given surface. This index has to be calculated, for the verifying period, both on the random selection of small areas belonging to the project and on a representative sample of areas outside of the project but located in the surrounding area and with similar characteristics.
The result of the “Performance Benchmark” is the percentage of carbon stored by the project that would have been stored anyways if the project had not been implemented. Besides, the “Performance Benchmark” method is also used to demostrate the additionality of the project, this is, that its CO2 absorptions are higher than the baseline, which is a requirement for any CO2 absorption project.
Finally, the final balance of CO2 absorption of the project was calculated and with it the carbon credits to request. Also, all the documentation requested by the certifying body related to the work of TYC GIS was elaborated, including mapping products, results tables or GIS shapefiles.
Customer: ETG Climate Solutions

 (4 votos, promedio: 5.00 de 5)
![]() Loading...
Loading...


Leave A Comment