It is no secret that Spain is, to a large extent, a place that enjoys long summers and many hours of sunshine. This creates enormous potential for sectors such as tourism, agriculture and electricity generation, but also creates problems in day-to-day life. It happens, for example, that thousands of workers have to carry out their work in the street and sometimes have to perform tasks under a blazing sun. This is why the company Rivamadrid, Rivas Vaciamadrid municipal services company, thought of designing routes that would minimize the sun exposure of its workers, thus improving their working conditions and reducing the risks involved in long days exposed to solar radiation and high temperatures. To achieve this, they needed to have information on which areas are in the shade at each hour of the day at each time of the year.
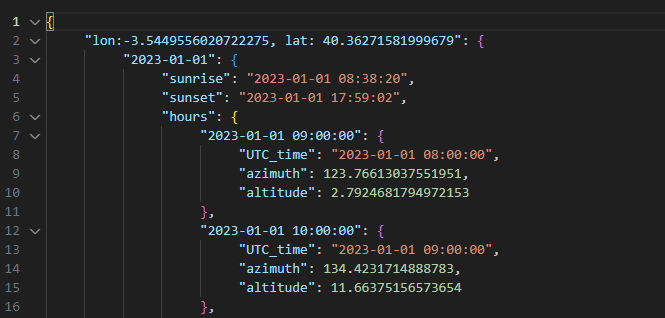
That’s where TYCGIS comes in. Could we generate maps with the projection of shadows on the streets every hour from sunrise to sunset? Yes, we can. To do this we need to know the coordinates of the place and calculate the relative position of the sun (Azimuth and solar or elevation angle) at each hour of the day for the days we will use. In this case we will use the first day of each month and there are numerous online tools for this, such as SunEarthTools, which gives us the data we need just by entering the coordinates, the time we want to consult and the time zone to which this time belongs (we might want to know what time Spanish sunrise is in Lima). To speed up the process and above all to gain flexibility, instead of using these resources, we developed a tool that allows us to obtain a JSON file with the elevations for as many time intervals for the days we need.
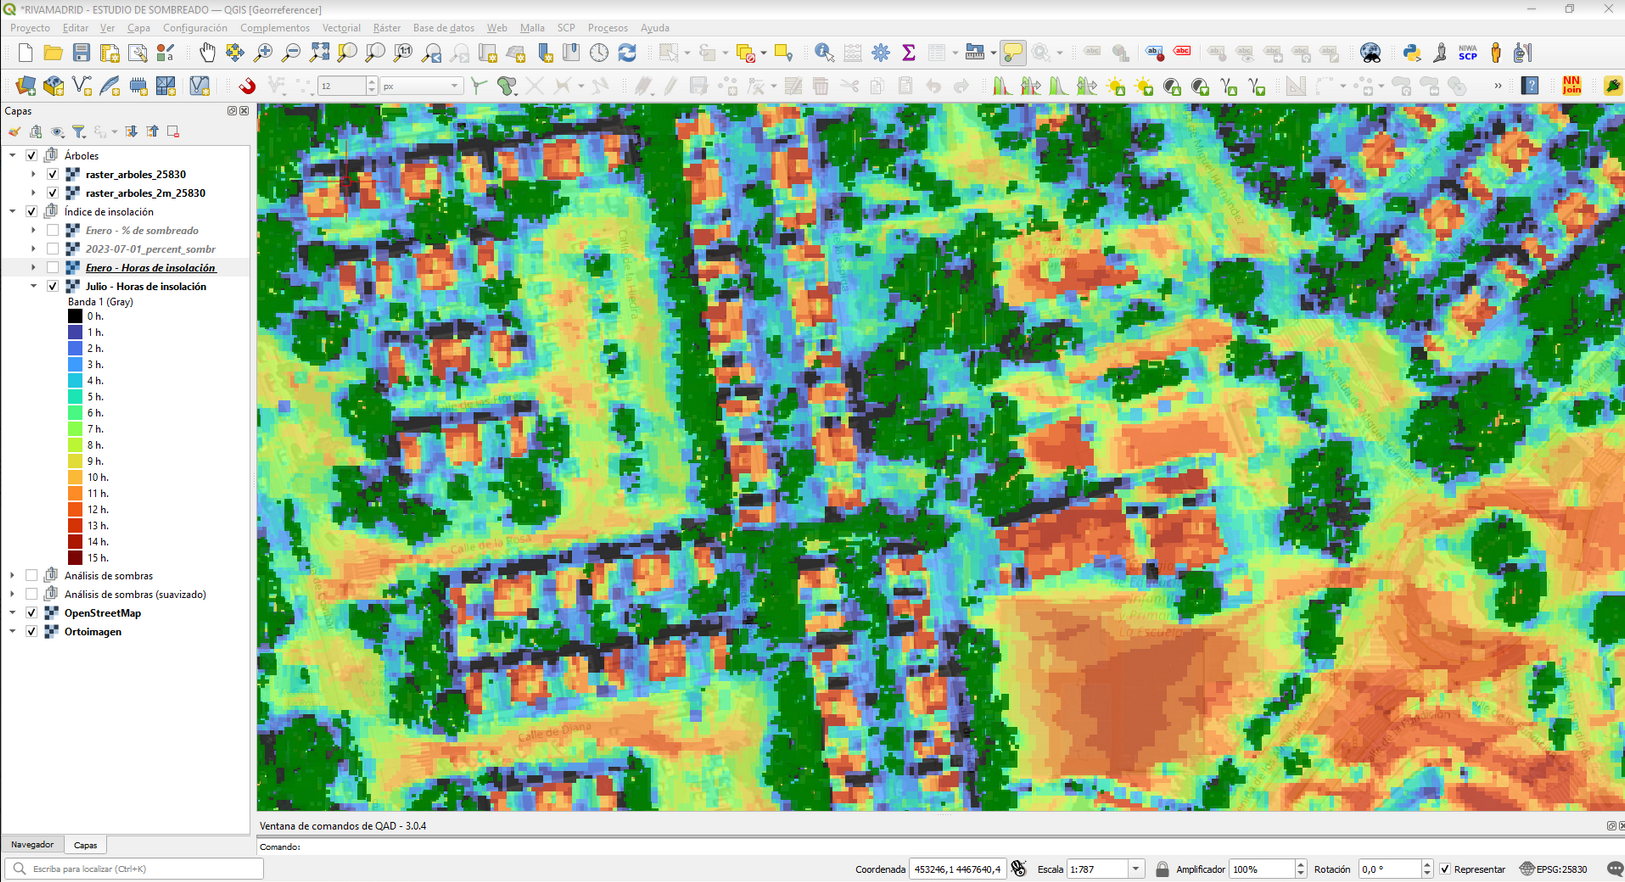
Now we need surface models (MDS), first we tried to use the MDS that the National Geographic Institute (IGN) makes publicly available in its download center. Unfortunately, the MDS available are models with a mesh pitch of 2.5 meters, which did not give us a good result, especially when calculating tree shadows. To improve this, we resorted to work directly on the LIDAR data and obtain our own models, using software such as LASTools and CloudCompare, we achieved models of Surfaces with and without trees for the differentiation of the winter months in which the deciduous trees do not cast as much shadow.
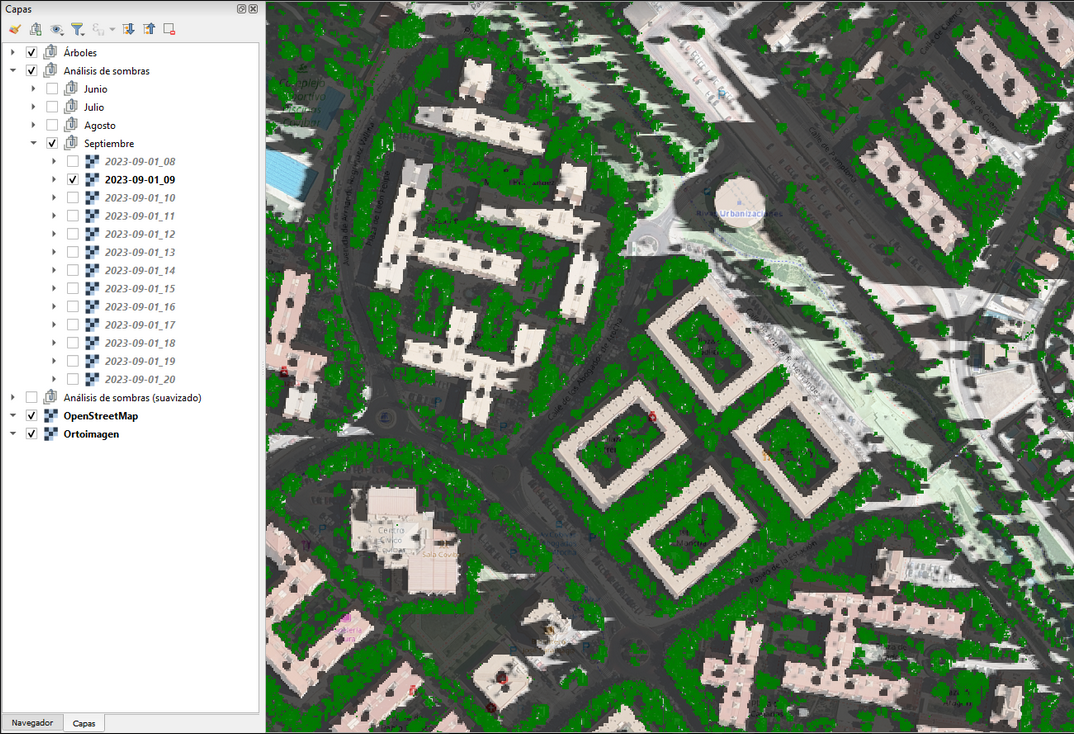
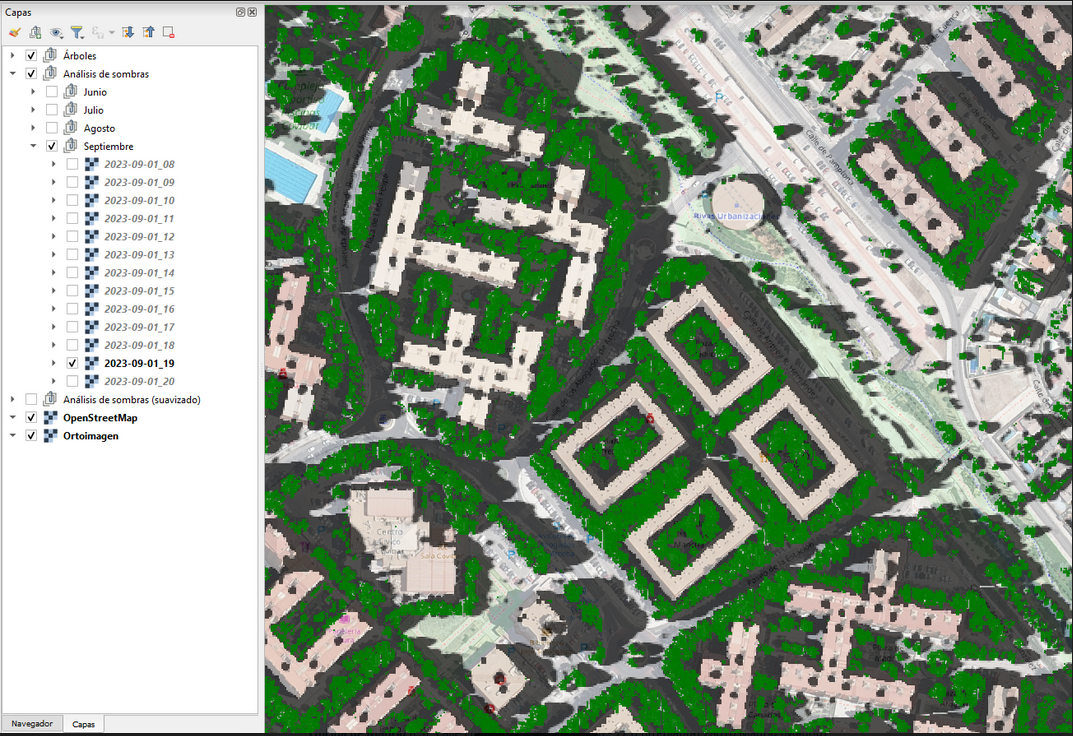
As a final result, we made a composition on a base map, where we superimpose a layer with the trees and another with the projected shadows. On these maps, routes can be traced trying to minimize the sun exposure of employees in the development of their work.
September 1st 9h:
September 1st 19h:
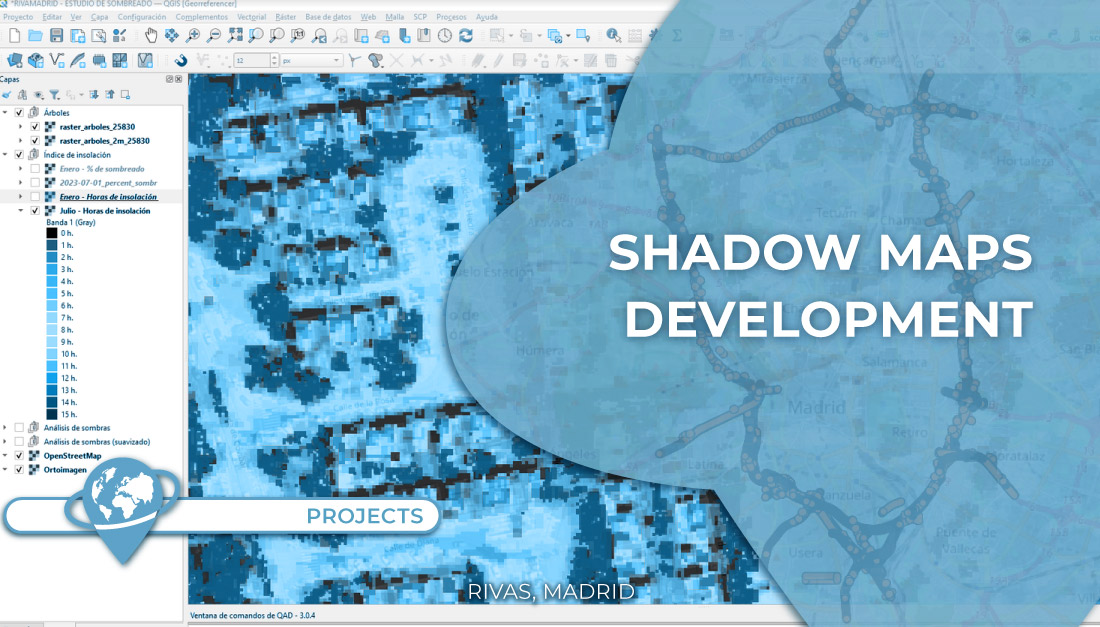
As an additional product to the initial purpose, insolation hours maps were also obtained for each day studied. In this case, a simple sum of the hours of insolation for each day was made for each pixel analyzed, but the study could be enriched with solar azimuth and climatic data if other indexes were desired for the calculation of the estimated incident energy for each point in an entire year, in an agricultural season, etc.
In the end, in TYCGIS, we are very used to carry out projects where GIS is used to increase performance from an economic perspective and it is very rewarding when you have the opportunity to do a job that directly affects the quality of life of people and see how you can also use geographic information systems to improve the lives of people, in this case enabling improvements in occupational safety and welfare at work.
Customers:
![]()
 (3 votos, promedio: 5.00 de 5)
![]() Loading...
Loading...


Leave A Comment